. 2025 Jun 19;67(1):35.
doi: 10.1186/s13028-025-00818-5.

Physiological response to weight carrying and associations with conformation traits in Icelandic horses used for tour riding

Affiliations

Physiological response to weight carrying and associations with conformation traits in Icelandic horses used for tour riding

Denise Söderroos et al. Acta Vet Scand. .

Abstract

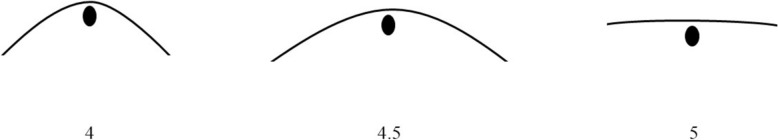
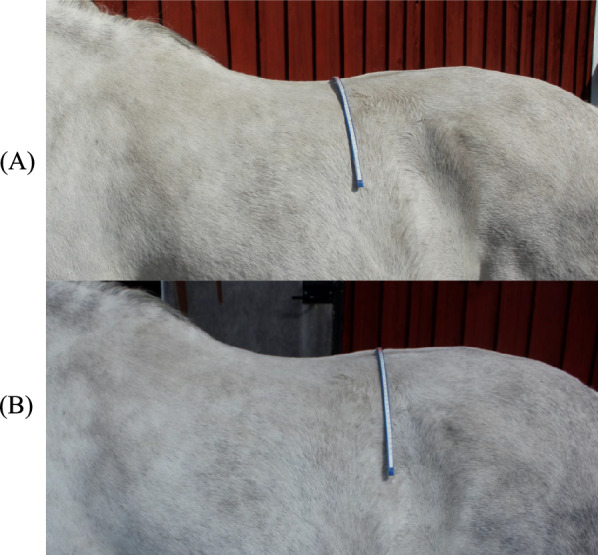
Background: Weight carrying capacity is an important trait in riding horses and it may be associated with conformation. This study examined the physiological response to a ridden incremental weight carrying test in 16 adult Icelandic horses used for tour riding. Horses carried 20% (BWR20%), 25% (BWR25%), 30% (BWR30%) and 35% (BWR35%) of their body weight (BW) in tölt (~ 5.7 m/seconds, 640 m/step), and associations with body measurements and back conformation (score) were examined. Horses were divided into two groups (narrow or broad back) and body measurements were collected. Plasma lactate was analysed in blood samples collected after each step in the exercise test, an exponential equation was fitted, and BW-ratio was calculated for 2, 3 and 4 mmol/L (BWRLa2, BWRLa3 and BWRLa4). Plasma creatine kinase (CK) and aspartate amino transferase (AST) were analysed at rest and 24 h post exercise.

Results: Four out of 15 horses did not reach a plasma lactate concentration of 4 mmol/L, even at BWR35%. A positive correlation was found between chest width and BWRLa4 and between the difference between height at withers and croup and BWRLa2 (P < 0.05). Hock circumference and the difference between height at croup and back were negatively correlated with BWRLa2 (P < 0.05). The change in CK from rest to 24 h post exercise was negatively correlated with the difference between height at withers and height at back and croup (P < 0.05).

Conclusions: The physiological response to weight carrying was relatively low. A wider chest, "uphill" conformation, straight backline and smaller hock circumference were associated with weight carrying capacity, but group (narrow or broad back) was not.

Keywords: Back; Body measurements; Equine; Rider weight; Weight carrying exercise test.


Conflict of interest statement

Declarations. Ethics approval and consent to participate: The study was carried out under Reg. 460/2017 on the protection of animals used for scientific purposes, as permitted by the Icelandic Food and Veterinary Authority, Ref. No. 2109502. Consent for publication: Written consent for publication of photos of the horses was obtained from the horse owners. Prior publication: Data included in this article have previously been published in the Proceedings of the 7th Animal Welfare Science Symposium, 3–4 June 2024, Uppsala, Sweden. Competing interests: The authors declare that they have no competing interests.

Figures

Fig. 1
Fig. 1
Illustration of the thoracolumbar region of the back with different condition scores. Scores are ranging from 4 to 5 with 0.25 increments (a score of 4.25 and 4.75 are not shown in the figure) as described in a previous study [4] and based on the Henneke scale [12]. The backs are illustrated from a caudal view, and the black dots symbolises the spine
Fig. 2
Fig. 2
Measurement of the thoracolumbar region at two different sites using a flexible curve ruler. Flexible curve ruler placed at (a) the 18th thoracic vertebra identified by palpation of the last rib (i.e. back angle) and (b) at the height of the caudal part of the last rib (by palpating vertically from the rib up to the dorsal aspect of the lumbar region) (i.e. loin angle)
Fig. 3
Fig. 3
Curve from measurements of the thoracolumbar region on Icelandic horses using a flexible curve ruler. The angle (red arrow) of the region was measured from the drawn curve, using a goniometer [10]
Fig. 4
Fig. 4
Body measurements collected in 16 Icelandic horses. The measurements were: height at withers (highest thoracic vertebra) (yellow + red arrow) (WH), height at the lowest point of the back (BH), height at the highest point of the croup (tubera sacrale) (TSH), back length (BL), measured from the cranial part of tubera sacrale to the highest point of the withers, body length (BoL), measured from tuberculum majus humeri to the caudal end of the hindquarters (horizontally to tuber ischiadicum), breast depth (DB) (yellow arrow), measured from the withers and straight down to sternum, chest width (CW), measured between the points of the shoulders (tuberculum majus humeri), width of the pelvis between the points of the pelvis (tubera coxae) (WP), width of the hips between the hip joints (WH), maximum circumference of carpus (CC) and hock (tarsus) (TC) and minimum circumference of metacarpus (MCC) and metatarsus (MTC). Notice that the figure only describes the measurements and not the experimental conditions (experimental measurements were performed indoors on concrete floor and with horses in even body position)
Fig. 5
Fig. 5
Physiological responses recorded in 14 Icelandic horses during a ridden exercise test. Horses carried 20, 25, 30 and 35% of their body weight (LSM ± SE). Different letters (ad) indicate differences between body weight ratio values (P < 0.05)
Fig. 6
Fig. 6
Relationships between physiological parameters and body measurements in Icelandic horses performing a weight carrying test. The figure shows the relationship between a body weight ratio (BWR) at the lactate threshold (BWRLa4) and chest width (r = 0.77, P < 0.05), and between BWR at a plasma lactate concentration of 2 mmol/L (BWRLa2) and b the difference between height at withers and height at croup (tubera sacrale) (r = 0.68, P < 0.05), c the difference between height at croup (tubera sacrale) and height at back (r = − 0.71, P < 0.05) and d hock circumference (r = − 0.77, P < 0.05). Blue dots represent horses with narrow back (back score < 4.5), red dots horses with broad back (back score > 4.5) and black dots horses with a back score of 4.5 [12]

Similar articles

References

    1. Stefánsdóttir GJ, Ragnarsson S, Gunnarsson V, Jansson A. Physiological response to a breed evaluation field test in Icelandic horses. Animal. 2014;8:431–9. 10.1017/S1751731113002309. - PMC - PubMed
    1. Sloet Van Oldruitenborgh-Oosterbaan MMS, Barneveld A, Schamhardt HC. Effects of weight and riding on workload and locomotion during treadmill exercise. Equine Vet J. 1995;27:413–7. 10.1111/j.2042-3306.1995.tb04963.x
    1. Powell DM, Bennett-Wimbush K, Peeples A, Duthie M. Evaluation of indicators of weight-carrying ability of light riding horses. J Equine Vet Sci. 2008;28:28–33. 10.1016/j.jevs.2007.11.008.
    1. Stefánsdóttir GJ, Gunnarsson V, Roepstorff L, Ragnarsson S, Jansson A. The effect of rider weight and additional weight in Icelandic horses in tölt: part I. Physiological responses. Animal. 2017;11:1558–66. 10.1017/S1751731117000556. - PMC - PubMed
    1. Matsuura A, Mano H, Irimajiri M, Hodate K. Maximum permissible load for Yonaguni ponies (Japanese landrace horses) trotting over a short, straight course. Anim Welf. 2016;25:151–6. 10.7120/09627286.25.1.151.

LinkOut - more resources