

Sphingolipid metabolism-related genes for the diagnosis of metabolic syndrome by integrated bioinformatics analysis and Mendelian randomization identification
- PMID: 40537868
- PMCID: PMC12178068
- DOI: 10.1186/s13098-025-01803-8
Sphingolipid metabolism-related genes for the diagnosis of metabolic syndrome by integrated bioinformatics analysis and Mendelian randomization identification
Abstract
Background: The rising global incidence of metabolic syndrome (MetS) highlights the need for more effective diagnostic and therapeutic tools. Sphingolipid metabolites are crucial in MetS pathogenesis, and identifying related biomarkers could improve treatment strategies.
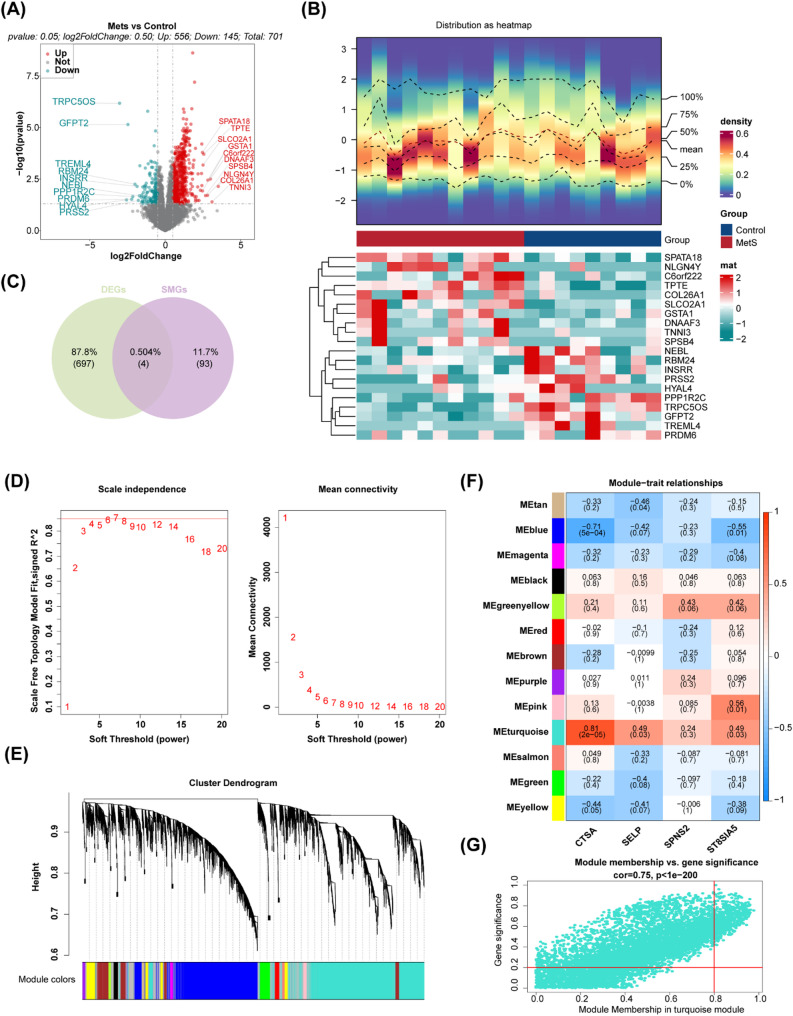
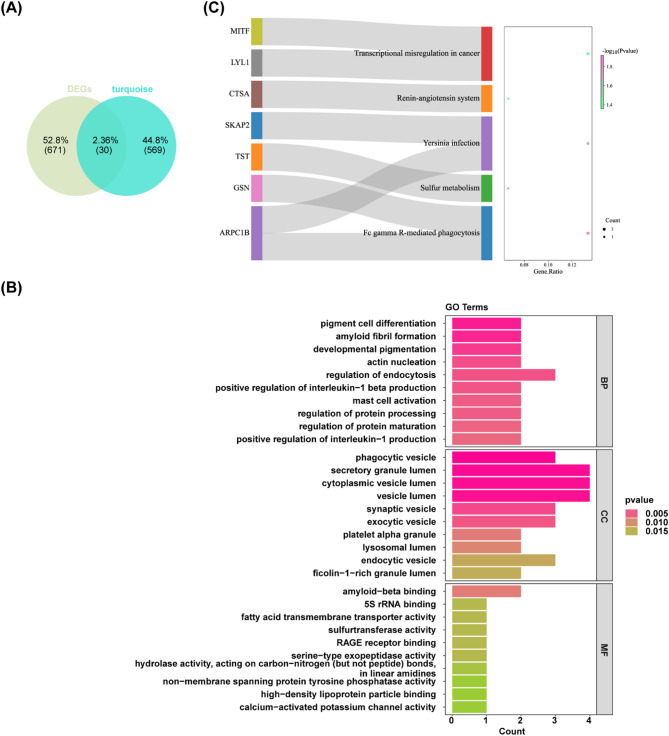
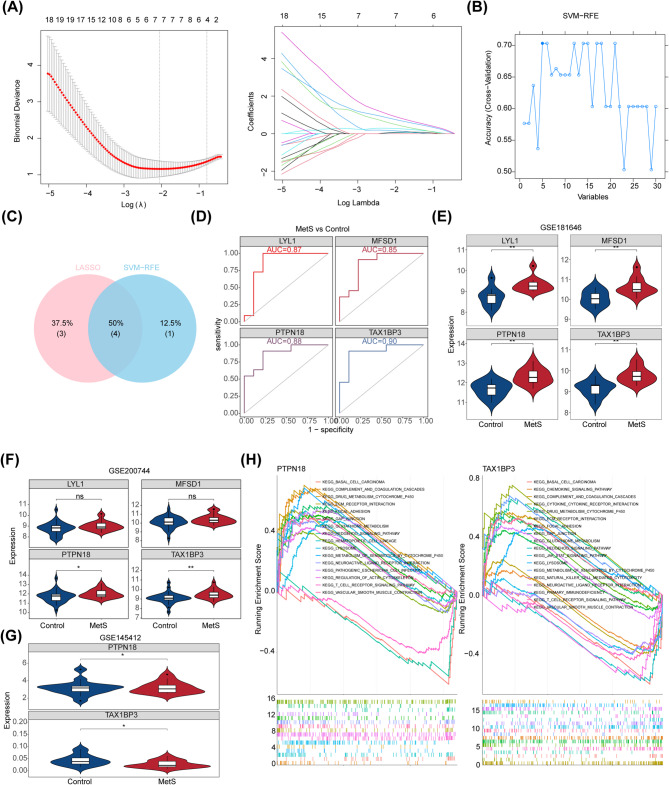
Methods: Differentially expressed genes (DEGs) were extracted from the GSE181646 dataset and compared with sphingolipid metabolism-related genes (SMRGs) to identify differentially expressed SMRGs (DE-SMRGs). Key module genes were obtained via Weighted Gene Co-expression Network Analysis (WGCNA). Machine learning and receiver operating characteristic (ROC) curve validation were used to screen biomarkers, followed by Gene Set Enrichment Analysis (GSEA) and immune cell infiltration analysis. Mendelian randomization (MR) was conducted to explore causal relationships between biomarkers and MetS-related diseases.
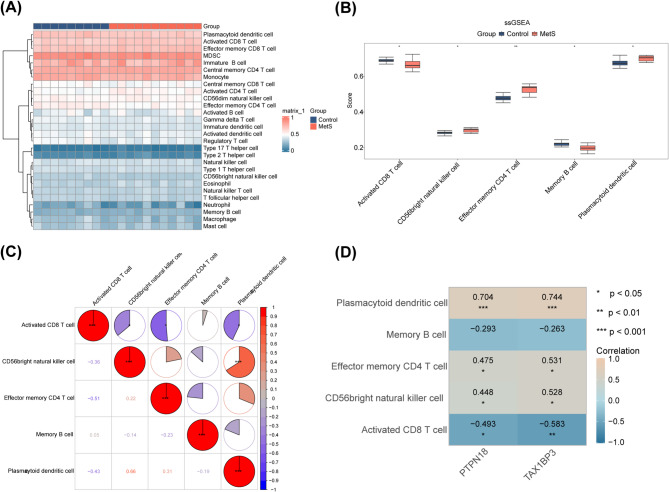
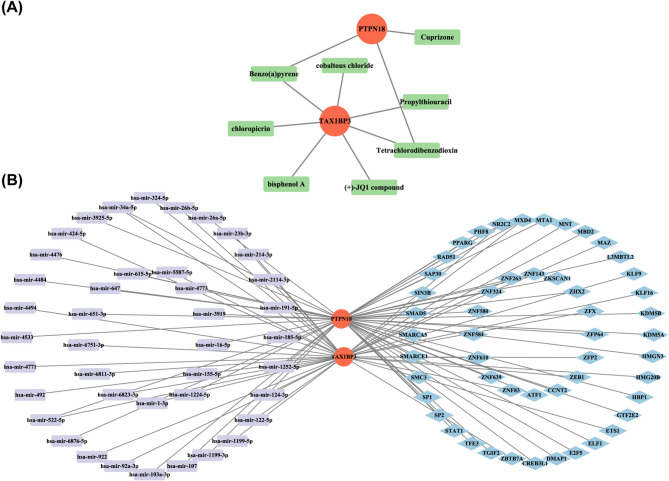
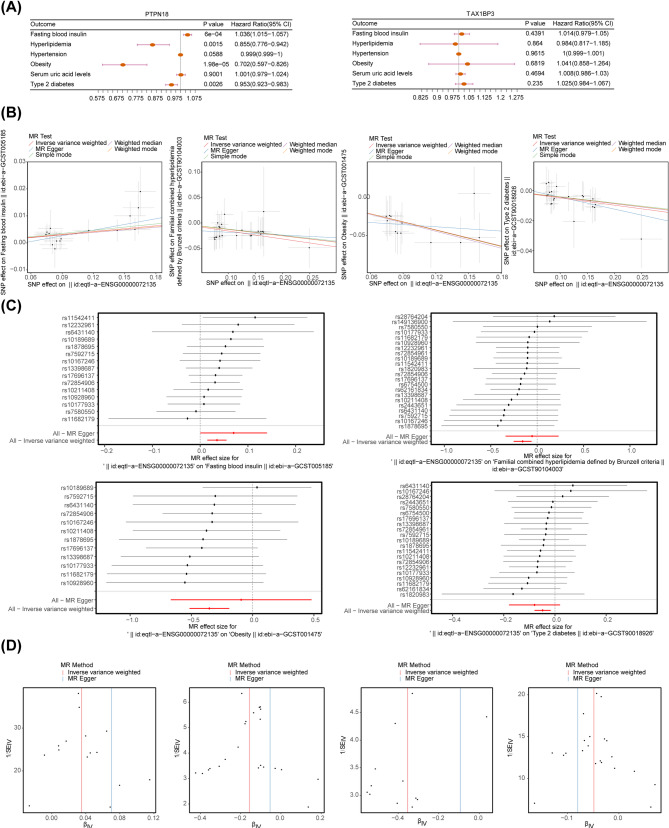
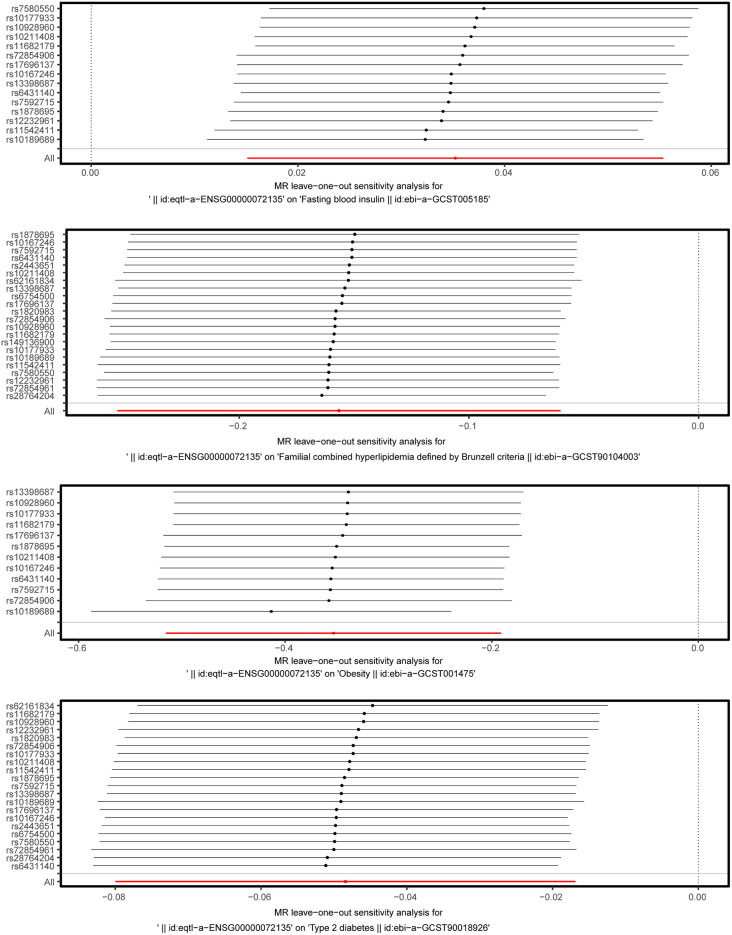
Results: A total of 701 DEGs, 599 key module genes, and 30 candidate genes were identified. PTPN18 and TAX1BP3 were validated as biomarkers and were found to be enriched in neuroactive ligand-receptor interactions and vascular smooth muscle contraction pathways. The levels of five immune cell types, including plasmacytoid dendritic cells, exhibited notable differences between the MetS and normal samples. TAX1BP3 exhibited a markedly negative correlation with activated CD8 T cell (r = -0.584), whereas it showed a markedly positive correlation with plasmacytoid dendritic cells (r = 0.744). MR analysis revealed that PTPN18 acted as a protective factor against obesity (P < 0.05, OR = 0.702), hyperlipidemia (P = 0.0015, OR = 0.855), and type 2 diabetes (P = 0.0026, OR = 0.953), but was associated with elevated fasting blood insulin (P < 0.05, OR = 1.036).
Conclusion: PTPN18 and TAX1BP3 were identified as sphingolipid metabolism-related biomarkers for MetS, offering potential promising targets for therapeutic intervention.
Keywords: Key module genes; Mendelian randomization; Metabolic syndrome; PTPN18 and TAX1BP3; Sphingolipid metabolism.
© 2025. The Author(s).
Conflict of interest statement
Declarations. Ethics statement: This study only used published or publicly available data. Ethical approval for each study included in the investigation can be found in the original publications (including informed consent from each participant). The studies were conducted in accordance with the local legislation and institutional requirements. The participants provided their written informed consent to participate in this study. Competing interests: The authors declare no competing interests.
Figures
Similar articles
-
Exploring sphingolipid metabolism-related biomarkers for Parkinson's disease: a transcriptomic analysis.Front Neurol. 2025 Jun 4;16:1548322. doi: 10.3389/fneur.2025.1548322. eCollection 2025. Front Neurol. 2025. PMID: 40534738 Free PMC article.
-
Deciphering Shared Gene Signatures and Immune Infiltration Characteristics Between Gestational Diabetes Mellitus and Preeclampsia by Integrated Bioinformatics Analysis and Machine Learning.Reprod Sci. 2025 Jun;32(6):1886-1904. doi: 10.1007/s43032-025-01847-1. Epub 2025 May 15. Reprod Sci. 2025. PMID: 40374866
-
Integrated analysis of uterine leiomyosarcoma and leiomyoma utilizing TCGA and GEO data: a WGCNA and machine learning approach.Transl Cancer Res. 2025 May 30;14(5):2999-3016. doi: 10.21037/tcr-2024-2465. Epub 2025 May 13. Transl Cancer Res. 2025. PMID: 40530152 Free PMC article.
-
Cost-effectiveness of using prognostic information to select women with breast cancer for adjuvant systemic therapy.Health Technol Assess. 2006 Sep;10(34):iii-iv, ix-xi, 1-204. doi: 10.3310/hta10340. Health Technol Assess. 2006. PMID: 16959170
-
Intravenous magnesium sulphate and sotalol for prevention of atrial fibrillation after coronary artery bypass surgery: a systematic review and economic evaluation.Health Technol Assess. 2008 Jun;12(28):iii-iv, ix-95. doi: 10.3310/hta12280. Health Technol Assess. 2008. PMID: 18547499
References
-
- Fathi Dizaji B. The investigations of genetic determinants of the metabolic syndrome. Diabetes Metab Syndr. 2018;12(5):783–9. - PubMed
-
- Alberti KG, Eckel RH, Grundy SM, Zimmet PZ, Cleeman JI, Donato KA, Fruchart JC, James WP, Loria CM, Smith SC Jr. Harmonizing the metabolic syndrome: a joint interim statement of the International Diabetes Federation Task Force on Epidemiology and Prevention; National Heart, Lung, and Blood Institute; American Heart Association; World Heart Federation; International Atherosclerosis Society; and International Association for the Study of Obesity. Circulation 2009, 120(16):1640–1645. - PubMed
-
- Goguet-Rubio P, Klug RL, Sharma DL, Srikanthan K, Puri N, Lakhani VH, Nichols A, O’Hanlon KM, Abraham NG, Shapiro JI, et al. Existence of a strong correlation of biomarkers and MiRNA in females with metabolic syndrome and obesity in a population of West Virginia. Int J Med Sci. 2017;14(6):543–53. - PMC - PubMed
Grants and funding
LinkOut - more resources
Full Text Sources
Research Materials
