. 2025 Jun 19;22(6):648-671.
doi: 10.20892/j.issn.2095-3941.2024.0596.

Mitochondrial transplantation sensitizes chemotherapy to inhibit tumor development by enhancing anti-tumor immunity

Affiliations

Mitochondrial transplantation sensitizes chemotherapy to inhibit tumor development by enhancing anti-tumor immunity

Shumeng Lin et al. Cancer Biol Med. .

Abstract

Objective: Lung cancer is the leading cause of cancer-related deaths worldwide. Chemotherapy is associated with side effects, such as damage to myeloid cells and a reduction in the number of immune cells in patients. In addition, tumor cells hijack the mitochondria of immune cells through tunnel nanotubes, thereby weakening immune ability.

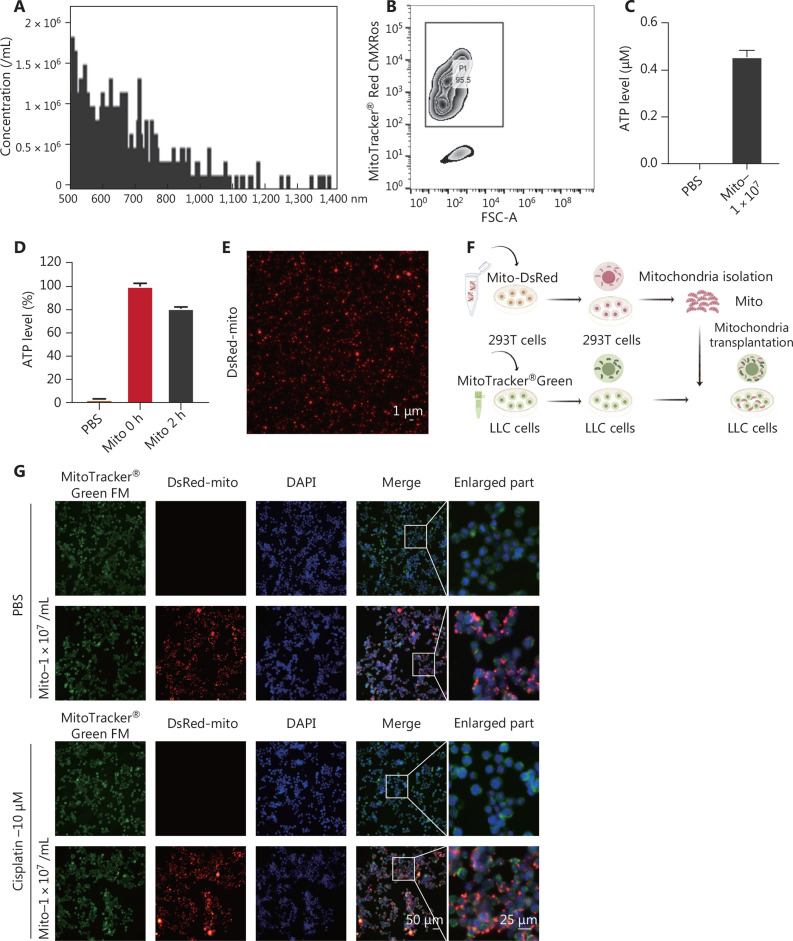
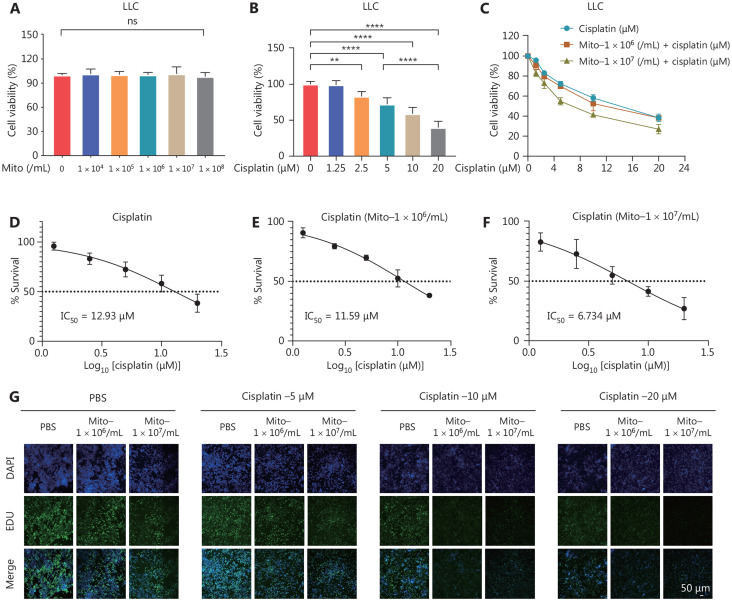
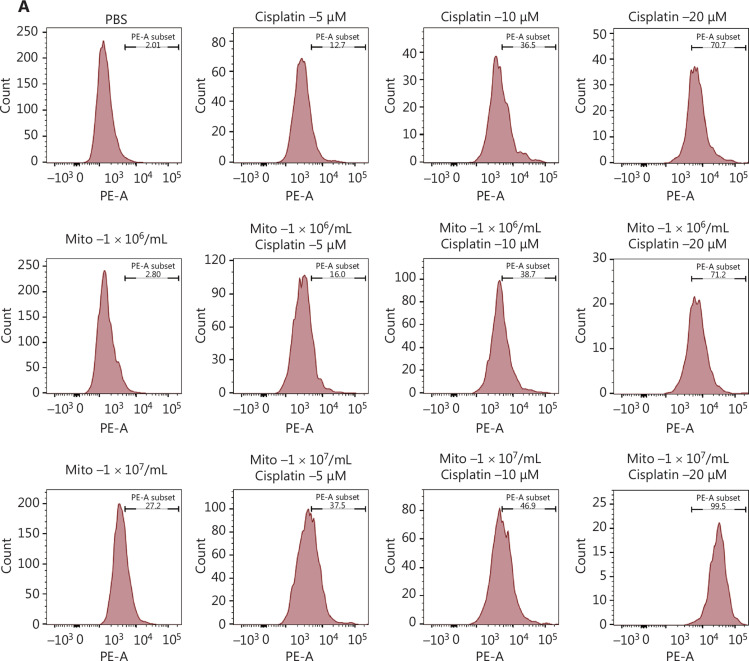
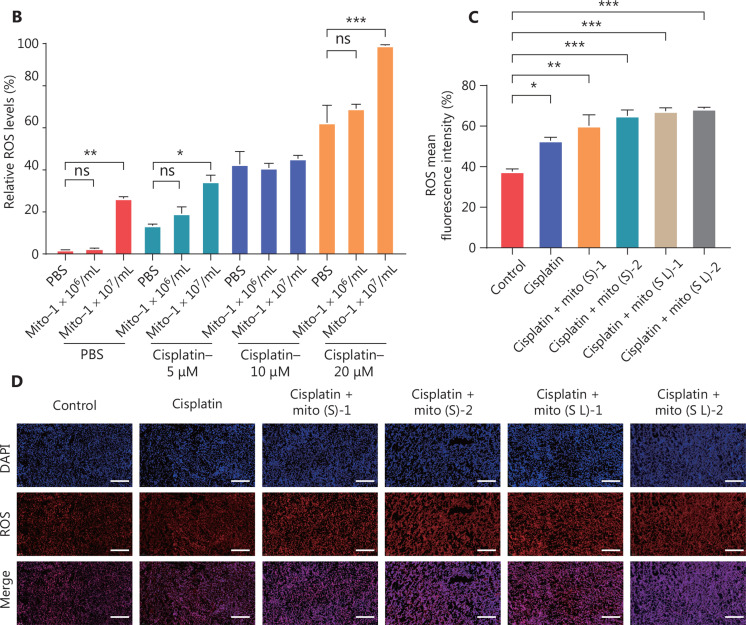
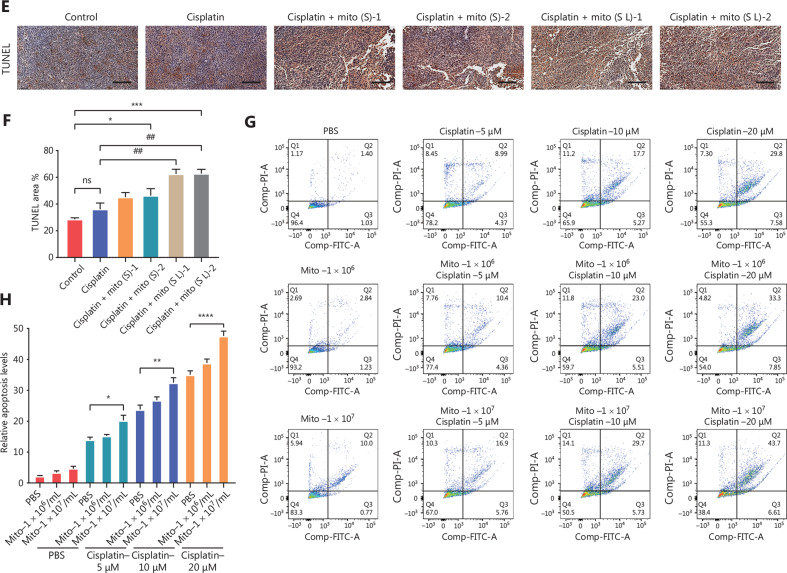
Methods: In this study the effects of direct mitochondria transplantation on cancer cell proliferation and chemotherapeutic sensitivity were determined, as well as anti-tumor immunity in in vitro and in vivo lung cancer models.

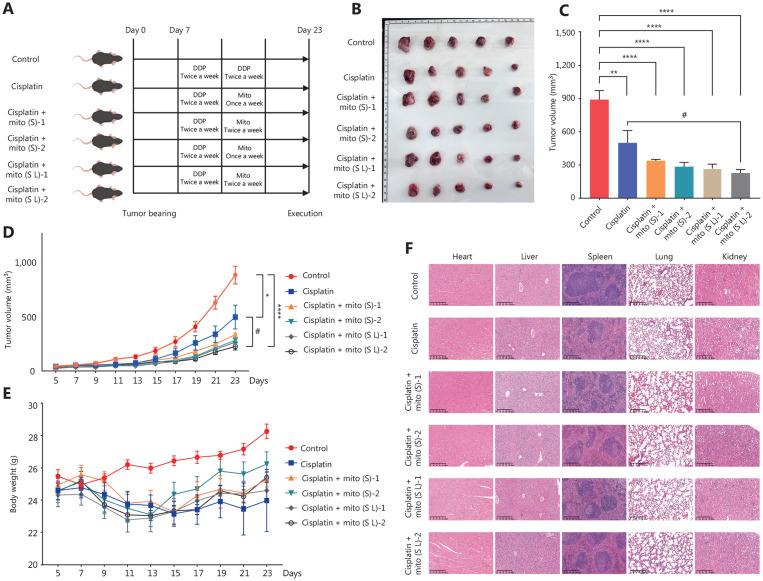
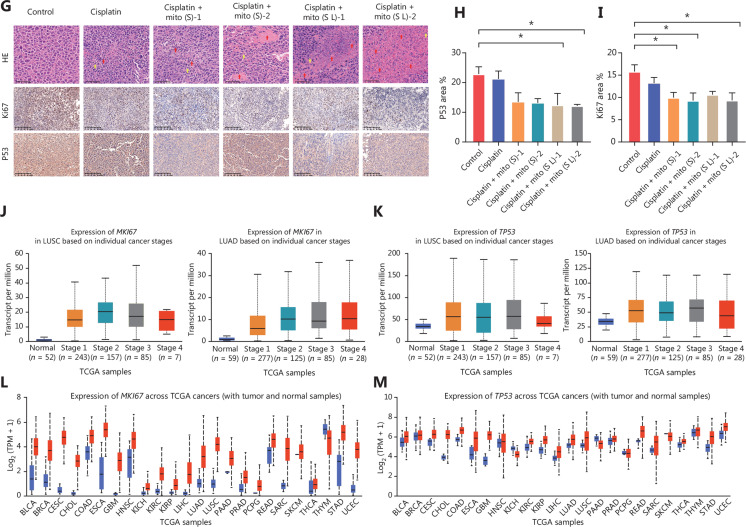
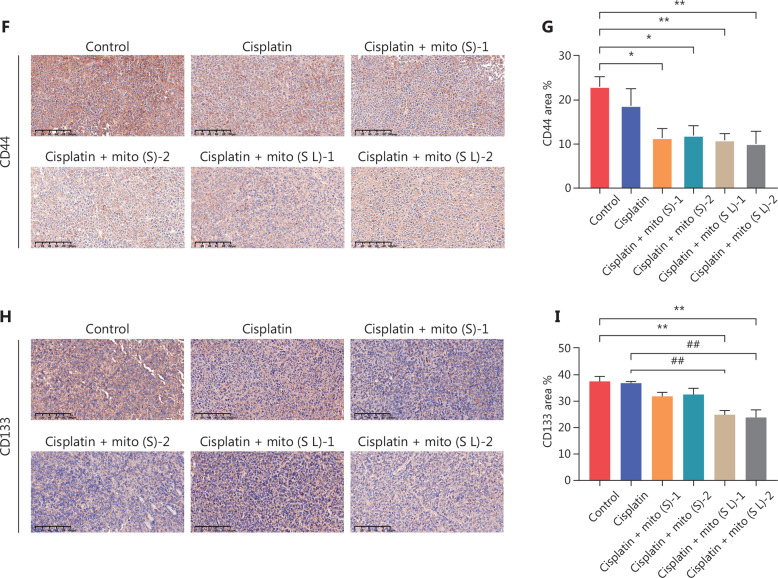
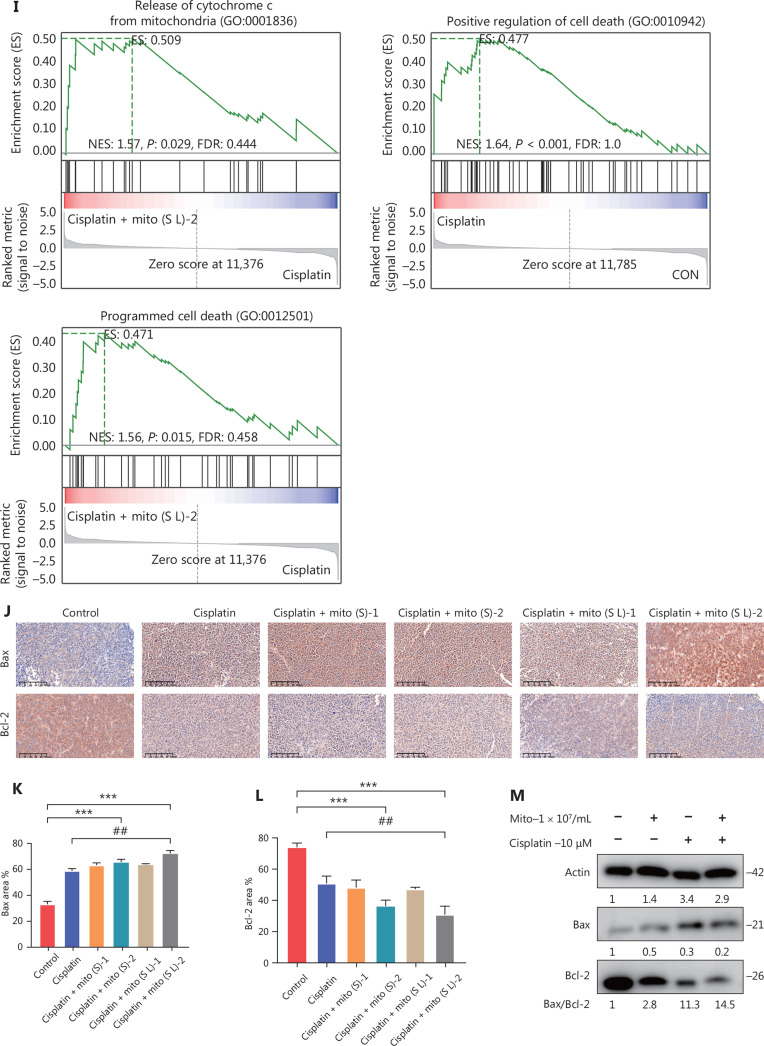
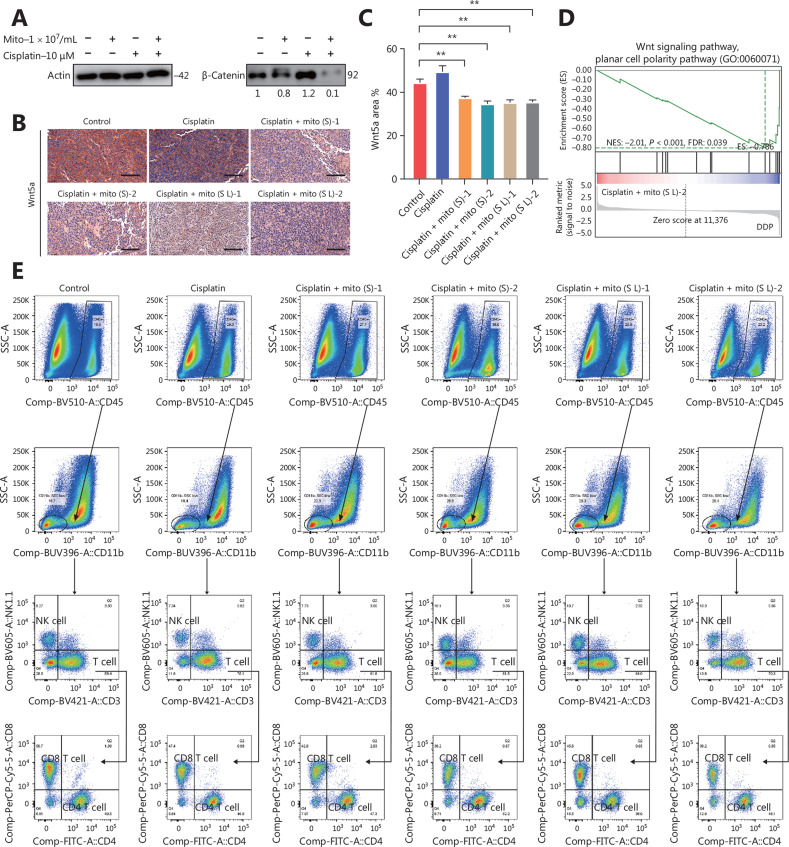
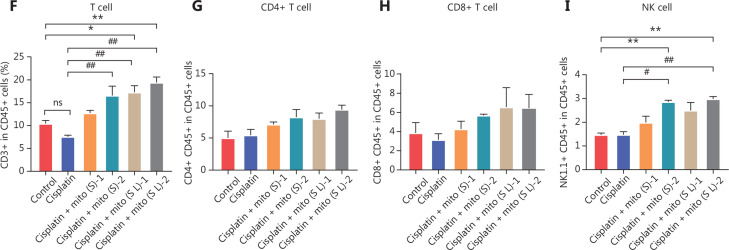
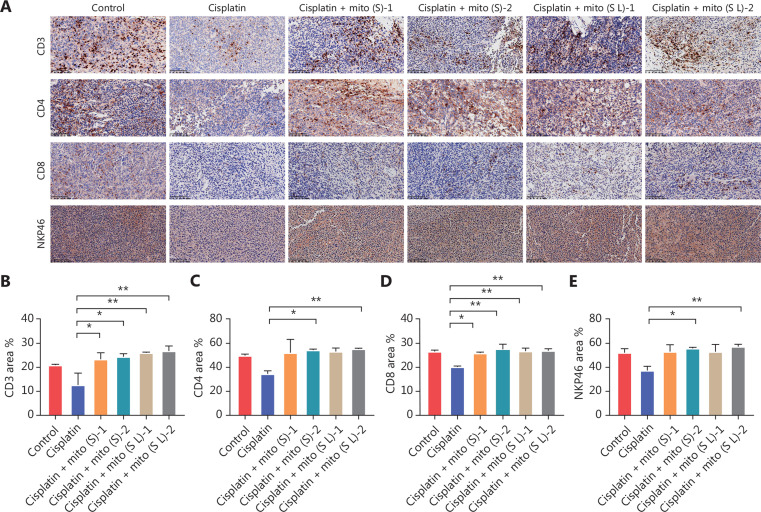
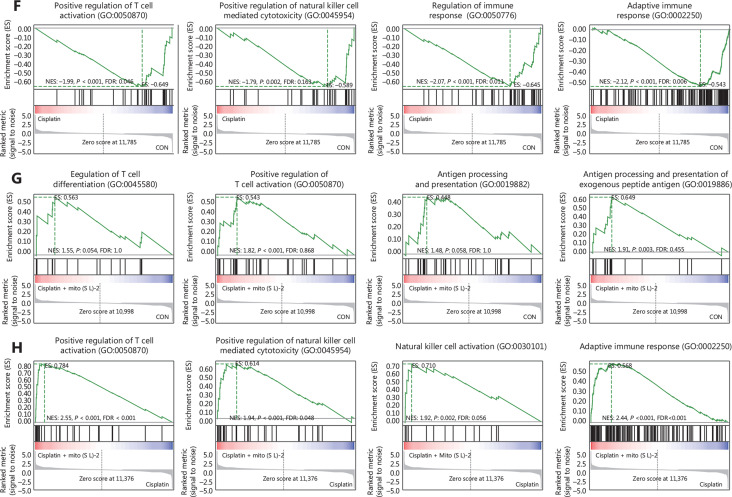
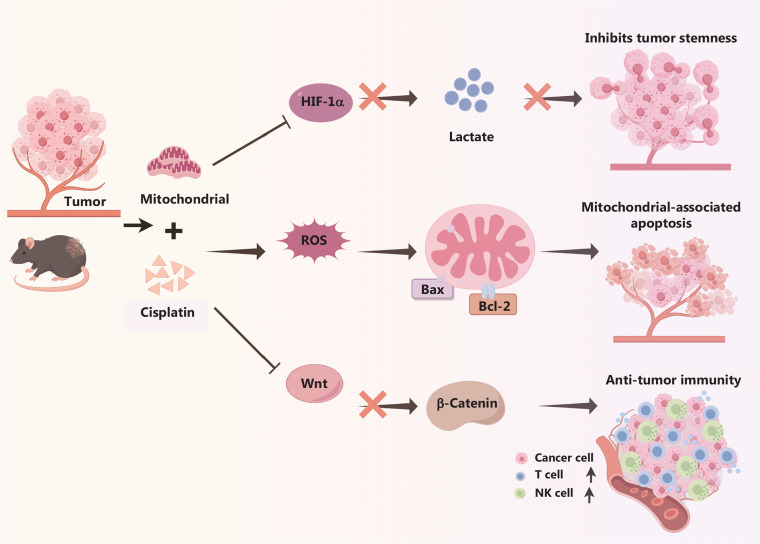
Results: A combination of mitochondrial transplantation and cisplatin chemotherapy was shown for the first time to significantly improve immune infiltration of advanced non-small cell lung cancer (NSCLC) and overcome the shortcomings of cisplatin chemotherapy, including damage to myeloid cells and a reduction in the number of immune cells.

Conclusions: The findings of the current study provide valuable recommendations for enhancing immune infiltration and augmenting anti-tumor efficacy during chemotherapy in advanced NSCLC. In addition, the findings support "mitochondrial transfer" as a novel paradigm in tumor treatment.

Keywords: Lung cancer; anti-tumor immunity; chemotherapy; cisplatin; mitochondria transplantation.


Conflict of interest statement

No potential conflicts of interest are disclosed.

Figures

Figure 1
Figure 1
Isolated mitochondria maintain structure and function. (A) A multisizer particle counter was used to quantify the diameters and amounts of the isolated mitochondria. (B) MitoTracker® Red CMXRos staining was utilized to evaluate the viability of the separated mitochondria. (C) ATP content in 1 × 10⁷ mitochondria. (D) Analysis of ATP levels in 2 h and fresh mitochondria. (E) Isolated mitochondria labeled with DsRed were observed via fluorescent microscopy. (F) Schematic diagram of the preparation and transplantation of mitochondria. (G) The absorption of co-incubated mitochondria in LLC cells is demonstrated. Scale bars, 25 and 50 μm.
Figure 2
Figure 2
Mitochondrial transplantation enhanced cisplatin sensitivity in LLC cells. (A–C) The viability of LLC cells treated with mitochondrial transplantation alone (A), cisplatin alone (B), and the combination treatment (C) at a series of concentrations was evaluated by CCK-8 assay. (D) The CCK-8 assay measured the cisplatin IC50 values. (E, F) The mitochondrial transplantation IC50 values at different concentrations combined with cisplatin treatment measured by the CCK-8 assay. (G) EDU staining displayed cell prefoliation in LLC cells after treatment with mitochondrial transplantation alone (1 × 10⁶/mL and 1 × 10⁷/mL), cisplatin alone (5, 10, and 20 μM), and combination treatment. Scale bars, 50 μm. The statistics, which are displayed as a percentage of untreated control cells, are representative of three comparable trials; each point is the mean ± SEM (n ≥ 3). **P < 0.01, and ****P < 0.0001 compared to the indicated group.
Figure 3
Figure 3
Mitochondrial transplantation suppressed cancer development in LLC cell xenografts. (A) A diagram of the xenograft mouse model and administration schedule. C57BL/6 mice were subcutaneously implanted with LLC cells, then randomized into the following six groups: control group, cisplatin; cisplatin with mito (systemic)-1 [cisplatin + mito (S)-1]; cisplatin with mito (systemic)-2 [cisplatin + mito (S)-2]; cisplatin with mito (systemic and local)-1 [cisplatin + mito (S L)-1]; and cisplatin with mito (systemic and local)-2 [cisplatin + mito (S L)-2]. (B–D) Characteristic pictures of tumors, tumor volumes, and tumor growth curves of C57BL/6 mice from various groups are displayed. (E) Body weight in the six groups of mice described above was statistically analyzed. (F) Typical HE staining images of principal organs in mice treated with various regimens. Scale bars, 200 μm. (G–I) HE and IHC staining of the tumor sections demonstrated the Ki67 and P53 levels in mice treated with various regimens. Scale bars, 50 or 100 μm. (J, K) Expression of MKI67 and TP53 in various stages of lung squamous cell carcinoma (LUSC) and lung adenocarcinoma (LUAD) (sequencing data from the TCGA database). (L, M) Expression of MKI67 and TP53 in pan-cancer (sequencing data from the TCGA database). */#P < 0.05, **P < 0.01, and ****P < 0.0001 compared to the indicated group.
Figure 3
Figure 3
Mitochondrial transplantation suppressed cancer development in LLC cell xenografts. (A) A diagram of the xenograft mouse model and administration schedule. C57BL/6 mice were subcutaneously implanted with LLC cells, then randomized into the following six groups: control group, cisplatin; cisplatin with mito (systemic)-1 [cisplatin + mito (S)-1]; cisplatin with mito (systemic)-2 [cisplatin + mito (S)-2]; cisplatin with mito (systemic and local)-1 [cisplatin + mito (S L)-1]; and cisplatin with mito (systemic and local)-2 [cisplatin + mito (S L)-2]. (B–D) Characteristic pictures of tumors, tumor volumes, and tumor growth curves of C57BL/6 mice from various groups are displayed. (E) Body weight in the six groups of mice described above was statistically analyzed. (F) Typical HE staining images of principal organs in mice treated with various regimens. Scale bars, 200 μm. (G–I) HE and IHC staining of the tumor sections demonstrated the Ki67 and P53 levels in mice treated with various regimens. Scale bars, 50 or 100 μm. (J, K) Expression of MKI67 and TP53 in various stages of lung squamous cell carcinoma (LUSC) and lung adenocarcinoma (LUAD) (sequencing data from the TCGA database). (L, M) Expression of MKI67 and TP53 in pan-cancer (sequencing data from the TCGA database). */#P < 0.05, **P < 0.01, and ****P < 0.0001 compared to the indicated group.
Figure 4
Figure 4
Transcriptomic sequencing analysis of mouse tumor tissues. (A–C) The analysis of GSEA was carried out on tissue samples from mice administered various treatments. The outcomes demonstrated that combination therapy enriched the indicated genomes. (D) Heatmap of transcriptome alterations. Differently expressed genes (DEGs) were detected in tumor specimens in mice administered various regimens. (E) Analysis of transcriptome statistics genes linked to mitochondrial complexes I–V in mouse tissues (FC > 1.2; P ≤ 0.05).
Figure 4
Figure 4
Transcriptomic sequencing analysis of mouse tumor tissues. (A–C) The analysis of GSEA was carried out on tissue samples from mice administered various treatments. The outcomes demonstrated that combination therapy enriched the indicated genomes. (D) Heatmap of transcriptome alterations. Differently expressed genes (DEGs) were detected in tumor specimens in mice administered various regimens. (E) Analysis of transcriptome statistics genes linked to mitochondrial complexes I–V in mouse tissues (FC > 1.2; P ≤ 0.05).
Figure 5
Figure 5
Mitochondrial transplantation reduced tumor stemness by inhibiting HIF-1α. (A, B) IHC showed increased HIF-1α expression in the tumor tissues of mice in each treatment group. Scale bars, 100 μm. Graph B is the quantitative statistics of graph A. (C) The ELISA assay was used to measure the lactic acid level in tumor tissues. (D) The results of GSEA analysis confirmed enrichment of the gene sets associated with response to hypoxia in tumor tissues. (E) Western blotting displayed the amounts of CD44 and CD133 protein in LLC cells. (F–I) The IHC assays demonstrated the level of CD44 (F, G) and CD133 (H, I) in mice administered various treatments. Scale bars, 100 μm. *P < 0.05, **/##P < 0.01, ***P < 0.001 and ****P < 0.0001 compared to the indicated group.
Figure 5
Figure 5
Mitochondrial transplantation reduced tumor stemness by inhibiting HIF-1α. (A, B) IHC showed increased HIF-1α expression in the tumor tissues of mice in each treatment group. Scale bars, 100 μm. Graph B is the quantitative statistics of graph A. (C) The ELISA assay was used to measure the lactic acid level in tumor tissues. (D) The results of GSEA analysis confirmed enrichment of the gene sets associated with response to hypoxia in tumor tissues. (E) Western blotting displayed the amounts of CD44 and CD133 protein in LLC cells. (F–I) The IHC assays demonstrated the level of CD44 (F, G) and CD133 (H, I) in mice administered various treatments. Scale bars, 100 μm. *P < 0.05, **/##P < 0.01, ***P < 0.001 and ****P < 0.0001 compared to the indicated group.
Figure 6
Figure 6
Mitochondrial transplantation led to ROS elevation and induced mitochondria-related apoptosis. (A, B) Flow cytometry demonstrated the ROS level in LLC cells that were untreated or received cisplatin, mitochondrial transplantation, or a combination of treatments. (C, D) Immunofluorescence revealed the amount of ROS in tumor tissues. Scale bars, 100 μm. (E, F) TUNEL assays for apoptosis in mice tumor tissues administered different treatments. Scale bars, 100 μm. (G, H) Flow cytometry demonstrated the apoptosis level in LLC cells that were untreated or received cisplatin, mitochondrial transplantation, or a combination of treatments. (I) The results of GSEA analysis indicated enrichment of the gene sets associated with programmed cell death. (J, K) IHC staining demonstrated the amount of Bax and Bcl-2 in tumor tissues from mice. Scale bars, 100 μm. (M) Western blotting showed the amount of Bax and Bcl-2 in LLC cells that were exposed to different treatments. *P < 0.05, **/##P < 0.01, ***P < 0.001 and ****P < 0.0001 compared to the indicated group.
Figure 6
Figure 6
Mitochondrial transplantation led to ROS elevation and induced mitochondria-related apoptosis. (A, B) Flow cytometry demonstrated the ROS level in LLC cells that were untreated or received cisplatin, mitochondrial transplantation, or a combination of treatments. (C, D) Immunofluorescence revealed the amount of ROS in tumor tissues. Scale bars, 100 μm. (E, F) TUNEL assays for apoptosis in mice tumor tissues administered different treatments. Scale bars, 100 μm. (G, H) Flow cytometry demonstrated the apoptosis level in LLC cells that were untreated or received cisplatin, mitochondrial transplantation, or a combination of treatments. (I) The results of GSEA analysis indicated enrichment of the gene sets associated with programmed cell death. (J, K) IHC staining demonstrated the amount of Bax and Bcl-2 in tumor tissues from mice. Scale bars, 100 μm. (M) Western blotting showed the amount of Bax and Bcl-2 in LLC cells that were exposed to different treatments. *P < 0.05, **/##P < 0.01, ***P < 0.001 and ****P < 0.0001 compared to the indicated group.
Figure 7
Figure 7
Mitochondrial transplantation by inhibiting Wnt signaling pathway promoted tumor immune infiltration. (A) Western blotting displayed the β-catenin level in LLC cells treated with cisplatin, mitochondria, or a combination. (B, C) The IHC assay showed the amount of Wnt5a in mice treated with different exposures. Scale bars, 50 μm. (D) The results of GSEA analysis confirmed enrichment of the gene sets associated with the Wnt signaling pathway. (E–I) Flow cytometry investigation of immune cell subsets in malignancies. Characteristic flow cytometry diagrams exhibiting NK cells, CD3+ T cells, CD4+ T cells, and CD8+ T cells in the tumors of mice undergoing various therapies. NK cells (I), CD3+ T cells (F), CD4+ T cells (G), and CD8+ T cells (H) as a percentage of tumors in mice undergoing various therapies. */#P < 0.05 and **/##P < 0.01 compared to the indicated group.
Figure 7
Figure 7
Mitochondrial transplantation by inhibiting Wnt signaling pathway promoted tumor immune infiltration. (A) Western blotting displayed the β-catenin level in LLC cells treated with cisplatin, mitochondria, or a combination. (B, C) The IHC assay showed the amount of Wnt5a in mice treated with different exposures. Scale bars, 50 μm. (D) The results of GSEA analysis confirmed enrichment of the gene sets associated with the Wnt signaling pathway. (E–I) Flow cytometry investigation of immune cell subsets in malignancies. Characteristic flow cytometry diagrams exhibiting NK cells, CD3+ T cells, CD4+ T cells, and CD8+ T cells in the tumors of mice undergoing various therapies. NK cells (I), CD3+ T cells (F), CD4+ T cells (G), and CD8+ T cells (H) as a percentage of tumors in mice undergoing various therapies. */#P < 0.05 and **/##P < 0.01 compared to the indicated group.
Figure 8
Figure 8
Mitochondrial transplantation promoted tumor immune infiltration. (A–E) The IHC assay displayed the expression of CD3, CD4, CD8, and NKP46. Scale bars, 100 μm. IHC staining quantification is displayed below. (F–H) The results of GSEA analysis demonstrated enrichment of genomes associated with T and NK cell-mediated immune responses. *P < 0.05 and **P < 0.01 compared to the indicated group.
Figure 8
Figure 8
Mitochondrial transplantation promoted tumor immune infiltration. (A–E) The IHC assay displayed the expression of CD3, CD4, CD8, and NKP46. Scale bars, 100 μm. IHC staining quantification is displayed below. (F–H) The results of GSEA analysis demonstrated enrichment of genomes associated with T and NK cell-mediated immune responses. *P < 0.05 and **P < 0.01 compared to the indicated group.
Figure 9
Figure 9
The schematic diagram illustrates the synergistic anti-tumor effect of the combination of mitochondrial transplantation and cisplatin. Mitochondrial transplantation combined with cisplatin inhibited tumor stemness by diminishing HIF-1α and reducing lactate accumulation. Mitochondrial transplantation plus cisplatin triggered the ROS-mediated mitochondrial apoptotic pathway. The combination of mitochondrial transplantation and cisplatin boosted T and NK cell-mediated anti-tumor immunity by preventing the Wnt/β-catenin pathway to inhibit tumor development. Representations shown in Figure 9 were created with figdraw.com.

Similar articles

References

    1. Bray F, Laversanne M, Sung H, Ferlay J, Siegel RL, Soerjomataram I, et al. Global cancer statistics 2022: GLOBOCAN estimates of incidence and mortality worldwide for 36 cancers in 185 countries. CA Cancer J Clin. 2024;74:229–63. - PubMed
    1. Siegel RL, Miller KD, Wagle NS, Jemal A. Cancer statistics, 2023. CA Cancer J Clin. 2023;73:17–48. - PubMed
    1. Miller KD, Fidler-Benaoudia M, Keegan TH, Hipp HS, Jemal A, Siegel RL. Cancer statistics for adolescents and young adults, 2020. CA Cancer J Clin. 2020;70:443–59. - PubMed
    1. Dasari S, Tchounwou PB. Cisplatin in cancer therapy: molecular mechanisms of action. Eur J Pharmacol. 2014;740:364–78. - PMC - PubMed
    1. Liu Z, Yu Z, Chen D, Verma V, Yuan C, Wang M, et al. Pivotal roles of tumor-draining lymph nodes in the abscopal effects from combined immunotherapy and radiotherapy. Cancer Commun (Lond) 2022;42:971–86. - PMC - PubMed

LinkOut - more resources