. 2025 Jul;603(14):4005-4025.
doi: 10.1113/JP288350. Epub 2025 Jun 19.

Input-specific bidirectional regulation of hippocampal CA3 pyramidal cell excitability

Affiliations

Input-specific bidirectional regulation of hippocampal CA3 pyramidal cell excitability

Kisang Eom et al. J Physiol. 2025 Jul.

Abstract

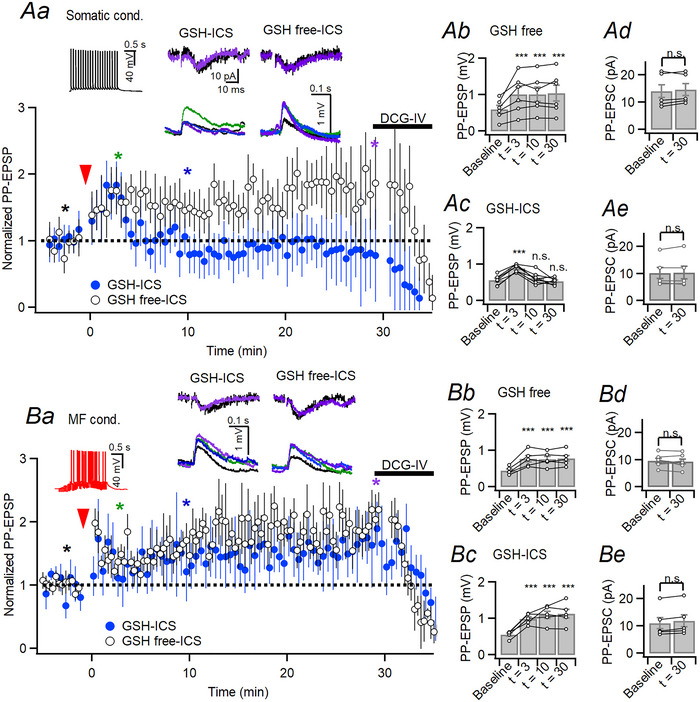
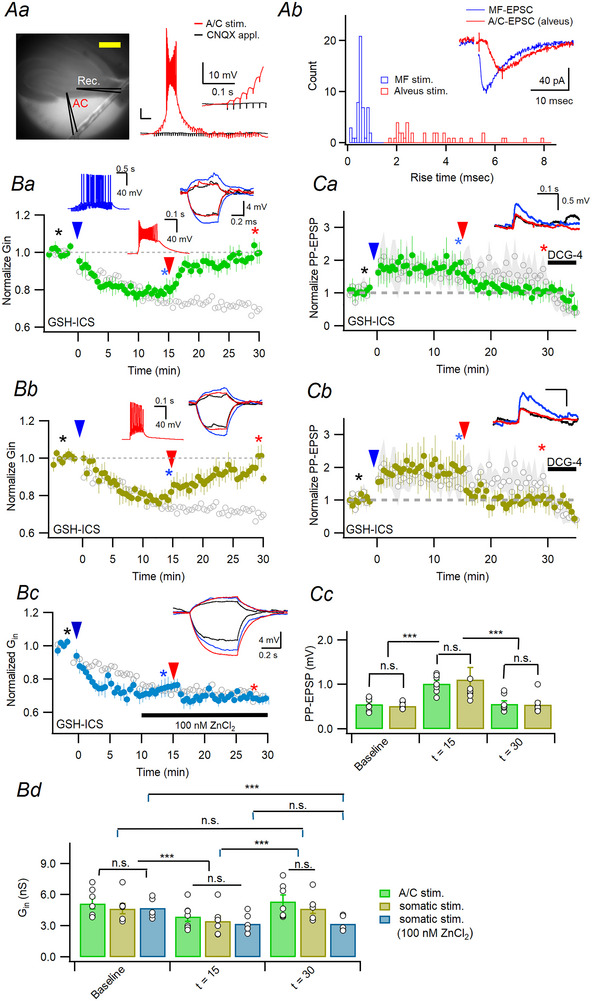
High-frequency mossy fibre (MF) inputs trigger a sustained increase in excitability to perforant pathway (PP) inputs in CA3 pyramidal cells (CA3-PC) by reducing Kv1.2 levels at distal apical dendrites, known as long-term potentiation of intrinsic excitability (LTP-IE). LTP-IE enhances excitatory postsynaptic potential (EPSP)-to-spike coupling at PP synapses, facilitating Hebbian LTP of synaptic weights. Prolonged hyperexcitability is detrimental, yet it is little understood how LTP-IE is restored in CA3-PCs. Here we show that MF-induced LTP-IE can be reversed through the burst firing of a CA3-PC elicited by PP or recurrent synaptic inputs. This reversal was impeded by the oxidative bias of cellular redox state or intracellular Zn2+ signalling. Because high-frequency PP inputs to MF-primed CA3 pyramidal cells not only induce homosynaptic LTP but also restore hyperexcitability, this input-specific bidirectional regulation of intrinsic excitability may provide a cellular basis for understanding ensemble dynamics in the CA3 network. KEY POINTS: Intrinsic excitability plays a pivotal role in recruiting principal cells to neuronal memory ensembles. Mossy fibre inputs prime hippocampal CA3 pyramidal cells by enhancing their intrinsic excitability and excitatory postsynaptic potential (EPSP)-to-spike coupling at perforant path (PP) synapses. High-frequency PP inputs to such primed cells not only induce long-term potentiation of synaptic weights but also restore the high excitability state to baseline. This input-specific bidirectional regulation of intrinsic excitability may offer a cellular basis for understanding the ensemble dynamics in the hippocampal CA3 network.

Keywords: CA3; Kv1.2; hippocampus; intrinsic plasticity; mossy fibre; pyramidal cell; redox; tyrosine phosphatase.


Conflict of interest statement

None declared.

Figures

Figure 1
Figure 1. Intracellular signalling cascade that mediates mossy fibre (MF) conditioning‐induced downregulation of Kv1.2 in CA3‐PCs based on the previous studies (Eom et al., ; Hyun et al., 2013, 2015)
(1) High‐frequency MF inputs elicit back‐propagating action potentials (bAPs), which induce dendritic Ca2+ signalling through L‐type voltage‐dependent Ca2+ channels (VDCC). (2) The dendritic Ca2+ signalling activates protein tyrosine kinase (PTK), which induces endocytosis of Kv1.2 at distal apical dendrites. This downregulation of Kv1.2 underlies long‐term potentiation of intrinsic excitability (LTP‐IE). (3) The dendritic Ca2+ signalling activates not only PTK but also receptor protein tyrosine phosphatase alpha (RPTPα), which antagonizes the PTK‐dependent downregulation of Kv1.2. Thus dendritic Ca2+ signalling alone caused by bAPs upon somatic current injection induces LTP‐IE only in a narrow range of [Ca2+]i (c.a. 340–380 nm; Eom et al., 2019). (4) High‐frequency MF inputs, however, induce intracellular Zn2+ signalling together with bAP‐mediated Ca2+‐signalling in postsynaptic CA3‐PCs. The Zn2+ signalling inhibits RPTPα, and thus disinhibits the action of PTK leading to the facilitation of LTP‐IE. [Colour figure can be viewed at wileyonlinelibrary.com]
Figure 2
Figure 2. Differential effects of intracellular glutathione (GSH) on somatic and mossy fibre (MF) conditioning‐induced long‐term potentiation of intrinsic excitability (LTP‐IE)
Aa and Ba, baseline‐normalized input conductance (Gin, Aa) and PP‐evoked excitatory postsynaptic potential (PP‐EPSP) amplitude of CA3‐PCs measured using a patch pipette solution containing 5 mm GSH (GSH‐ICS). Insets, representative traces for subthreshold voltage responses (Aa) and PP‐EPSPs (Ba) at the time indicated by asterisks (black, 5 min; red, 45 min). Ab and Bb, summary for Gin (Ab) and PP‐EPSP amplitudes (Bb) of CA3‐PCs. Reduced GSH in the patch pipette solution altered neither Gin (3.96 ± 0.26 to 3.81 ± 0.32 nS, 10 neurons from 10 slices in six animals, t = 1.231, P = 0.250, paired t test) nor PP‐EPSP amplitudes (0.59 ± 0.10 to 0.55 ± 0.13 mV, nine neurons from nine slices in six animals, t = 0.324, P = 0.755, paired t test) over the recording time. C, the latency of the first action potential (1st AP latency, Ca‐Cb) and AP threshold (Cc) measured from voltage responses to a ramp current injection (250 pA/s) were not different between 5 min and at 45 min of whole‐cell recording. Ca, spike responses to somatic ramp current injection (250 pA/s, black, at 5 min; red, at 45 min). Cb‐c, mean values for the 1st AP latency (Cb, 616.64 ± 71.79 to 584.87 ± 87.82 ms, seven neurons from seven slices in five animals, t = 0.548, P = 0.603, paired t test) and the AP threshold (Cc, −44.64 ± 1.43 to −43.99 ± 2.86 mV, seven neurons from seven slices in five animals, t = –0.365, P = 0.728, paired t test). Da, time courses of baseline‐normalized Gin induced by somatic conditioning under the GSH‐ICS (blue symbols) and GSH‐free ICS (open circles) conditions. Left insets, voltage responses to somatic conditioning. Somatic conditioning was done by somatic injection of 20 short suprathreshold current pulses at 10 Hz. Right two insets, voltage responses to subthreshold current injection (+10 and −30 pA) for measuring Gin before and after somatic or MF conditioning under GSH‐ICS (middle) and GSH free‐ICS (right) conditions. Db‐Dc, summary for Gin at the baseline, 3, 10 and 30 min after the somatic conditioning under GSH free‐ICS (Db) and GSH‐ICS (Dc). GSH free‐ICS: 0 vs. 3 min, P = 0.012; 0 vs. 10 min, P = 0.002; 0 vs. 30 min, P = 0.007; 3 vs. 10 min, P = 0.070; 3 vs. 30 min, P = 0.319; 10 vs. 30 min, P = 0.550. GSH‐ICS: 0 vs. 3 min, P = 0.040; 0 vs. 10 min, P < 0.001; 0 vs. 30 min, P = 0.478, 3 vs. 10 min: P = 0.002, 3 vs. 30 min: P = 0.392, 10 vs. 30 min: P < 0.001. Time, F(3,51) = 13.248, P = 0.016; condition, F(1,17) = 7.161, P < 0.001; time × condition, F(3,51) = 2.210, P = 0.098. General linear model (GLM) and simple effect analysis. Dd‐De, voltage responses to somatic injection of a ramp current (250 pA/s, 1 s) measured before (black) and 30 min (red) after the somatic conditioning under GSH free‐ICS (Dd) and GSH‐ICS (De). Df‐Dg, mean latency of first AP before and 30 min after the somatic conditioning under GSH free‐ICS (Df; t = 5.123, P = 0.002; seven neurons from seven slices in five animals; paired t test) and GSH‐ICS (Dg; t = 2.160, P = 0.054; 12 neurons from 12 slices in eight animals; paired t test). E, same as D but MF conditioning instead of somatic conditioning. MF conditioning was done by MF stimulation at 20 Hz for 2 s. Ea, Gin of CA3‐PCs before and after MF conditioning under GSH‐ and GSH‐free ICS conditions. Eb‐Ec, Gin after MF conditioning. GSH free‐ICS (Eb): 0 vs. 3 min, P < 0.001; 0 vs. 10 min, P < 0.001; 0 vs. 30 min, P < 0.001, 3 vs. 10 min: P < 0.001, 3 vs. 30 min: P < 0.001, 10 vs. 30 min: P = 0.064. Time: F(3,45) = 60.909, P < 0.001; condition: F(1,15) = 0.063, P < 0.001; time × condition: F(3,45) = 1.177, P = 0.329. GSH‐ICS (Ec): 0 vs. 3 min, P < 0.001; 0 vs. 10 min, P < 0.001; 0 vs. 30 min, P < 0.001, 3 vs. 10 min: P = 0.007, 3 vs. 30 min: P = 0.004, 10 vs. 30 min: P = 0.051. GLM and simple effect analysis. Ed, Ee, voltage responses to a ramp current injection. Ef, Eg, means of first AP latency. GSH free‐ICS (Ef) t = 13.869, P < 0.001; five neurons from five slices in three animals; paired t test). GSH‐ICS (Eg) t = 7.209, P < 0.001; nine neurons from nine slices in six animals; paired t test. Fa‐b, representative traces of APs evoked by injection of a short current step (10 ms, 400–600 pA) under GSH‐ICS. For somatic (11 neurons from 11 slices in six animals, Fa) and MF conditioning (nine neurons from nine slices in five animals, Fb), AP traces were observed before conditioning (broken black), and 10 min (thick blue) and 30 min (red line) after conditioning. AP threshold was determined at the dV/dt is greater than 30 V/s (marked as a grey broken line). Fc‐d, AP threshold was affected neither by somatic conditioning nor by MF conditioning. Time: F(2,34) = 2.921, P = 0.068; condition: F(1,17) = 0.02, P = .889; time × condition: F(2,34) = 0.077, P = 0.926 (RM‐ANOVA). [Colour figure can be viewed at wileyonlinelibrary.com]
Figure 3
Figure 3. Differential effects of intracellular glutathione (GSH) on somatic and mossy fibre (MF) conditioning‐induced potentiation of PP‐evoked excitatory postsynaptic potentials (PP‐EPSPs)
Aa, time course for changes in baseline‐normalized PP‐EPSPs induced by somatic conditioning under the GSH‐ICS (blue symbols) and GSH‐free ICS (open circles). Insets, PP‐EPSCs (upper row) and PP‐EPSPs (lower row) before and after somatic conditioning under GSH‐ICS (left column) or GSH free‐ICS (right column) condition. The time points of recording are indicated by asterisks (baseline, black; 3 min, green; 10 min, blue; 30 min, magenta). The same colour code was used for the trace colour at each time point. Ab‐Ac, mean PP‐EPSP amplitudes at baseline, 3, 10 and 30 min after the somatic conditioning under GSH free‐ICS (Ab) and GSH‐ICS (Ac). GSH free‐ICS: 0 vs. 3 min, P = 0.002; 0 vs. 10 min, P = 0.002; 0 vs. 30 min, P = 0.001; 3 vs. 10 min, P = 0.940; 3 vs. 30 min, P = 0.358; 10 vs. 30 min, P = 0.614. GSH‐ICS: 0 vs. 3 min, P = 0.002; 0 vs. 10 min, P = 0.533; 0 vs. 30 min, P = 0.752; 3 vs. 10 min, P < 0.001; 3 vs. 30 min, P < 0.001; 10 vs. 30 min, P = 0.752. Time: F(3,33) = 17.305, P < 0.001; condition: F(1,11) = 0.0.158, P = 0.158; time × condition: F(3,33) = 9.299, P < 0.001. General linear model (GLM) and simple effect analysis. Ad‐Ae, mean PP‐EPSC amplitudes at baseline, 3 and 30 min after somatic conditioning under GSH free‐ICS (Ad) and GSH‐ICS (Ae). Time: F(1,10) = 0.206, P = 0.660; conditioning: F(1,10) = 4.054, P = 0.072; GSH free‐ICS, F(1,8) = 4.054, P = 0.060; GSH‐ICS, F(1,8) = 3.102, P = 0.109, RM‐ANOVA. B, same as A but MF conditioning instead of somatic conditioning. Ba, PP‐EPSP changes induced by MF conditioning. Insets, PP‐EPSCs (upper row) and PP‐EPSPs (lower row) before and after the MF conditioning. Bb‐Bc, PP‐EPSP amplitudes under GSH free‐ICS (Bb) or GSH‐ICS (Bc). GSH free‐ICS: 0 vs. 3 min, P < 0.001; 0 vs. 10 min, P < 0.001; 0 vs. 30 min, P < 0.001; 3 vs. 10 min, P = 0.143; 3 vs. 30 min, P = 0.192; 10 vs. 30 min, P = 0.526. GSH‐ICS: 0 vs. 3 min, P < 0.001; 0 vs. 10 min, P < 0.001; 0 vs. 30 min, P < 0.001; 3 vs. 10 min, P = 0.867; 3 vs. 30 min, P = 0.898; 10 vs. 30 min, P = 0.623. Time, F(3,24) = 43.382, P < 0.001; condition, F(1,8) = 4.793, P = 0.060; time × condition, F(3,24) = 3.122, P = 0.045. GLM and simple effect analysis. Bd‐Be, PP‐EPSC amplitudes under GSH free‐ICS (Bd) or GSH‐ICS (Be). GSH free‐ICS: F(1,8) = 0.176, P = 0.686; GSH‐ICS, F(1,8) = 0.064, P = 0.807; time, F(1,8) = 4.189, P = 0.660; condition, F(1,8) = 0.115, P = 0.744; RM‐ANOVA. [Colour figure can be viewed at wileyonlinelibrary.com]
Figure 4
Figure 4. MF inputs, but not A/C inputs, induced dendritic Zn2+ signals in the CA3‐PCs
Aa, DIC image of a hippocampal slice with arrangements of a stimulating electrode (Stim.) and a whole‐cell patch electrode (Rec.), which are placed on the stratum lucidum and on a CA3‐PC, respectively. Scalebar, 500 µm. Ab, a fluorescence image of a CA3‐PC loaded with FluoZin‐3 through a whole‐cell patch pipette. The coloured box in the distal apical dendrite indicates a region of interest (ROI), in which fluorescence was measured. Ac, representative voltage responses of a CA3‐PCs evoked by mossy fibre (MF) stimulation (40 pulses at 20 Hz). MF synaptic inputs were evoked by the stimulation of stratum lucidum. Ad, averaged (red) and individual (grey) FluoZin‐3 fluorescence changes (ΔF/F0) evoked by MF stimulation. The fluorescence signal was measured at the ROI in Ab. Dotted lines in AcAd indicate the beginning and cessation time of MF stimulation. Ba, a representative voltage response of a CA3‐PC to bath application of aCSF containing 5 mm K+ and DCG‐IV (high‐K aCSF). To block MF and PP inputs we made two incisions through the hilus of the dentate gyrus and the hippocampal sulcus, and DCG‐IV was included in the high‐K aCSF. The high‐K aCSF‐evoked AP responses caused by A/C synaptic inputs (Fig. 2 C of Eom et al., 2019)). At the timing indicated by the blue arrowhead, the resting membrane potential (RMP) was re‐adjusted to the value observed before applying high‐K aCSF. Applying synaptic blockers (PTX and CNQX) abolished the high‐K aCSF‐induced AP responses. Bb, a FluoZin‐3 fluorescence image of a CA3‐PC. The coloured box indicates the ROI where fluorescence was measured Bc‐Bd, AP bursts (upper) and concomitant recordings for ΔF/F0 of FluoZin‐3 (lower) before (Bc) and after (Bd) the RMP re‐adjustment. The dotted lines indicate the start and end timing of the AP burst (upper: voltage responses; lower: fluorescence changes). Be, probability distributions of interspike intervals (ISIs) of the AP responses to high‐K aCSF before (green) and after (blue) the RMP re‐adjustment. C, summary for distal dendritic ΔF/F0 of FluoZin‐3 measured at 5 s (from start of AP bursts or stimulation) as a function of the number of APs evoked by 20 Hz MF stimulation for 2 s (red) or high‐K aCSF before and after RMP re‐adjustment. [Colour figure can be viewed at wileyonlinelibrary.com]
Figure 5
Figure 5. Depotentiation of mossy fibre (MF)‐induced long‐term potentiation of intrinsic excitability (LTP‐IE) can be induced by somatic or A/C synaptic stimulation and is hindered by supplement of Zn2+ in aCSF
Aa, Left, IR‐DIC image for whole‐cell patch pipette on the CA3‐PC and the glass electrode on the alveus of CA3 for stimulation of A/C synapses. scale bar, 500 µm. Right, voltage response of the CA3‐PC to alveus stimulation (20 Hz, 1 s) before (red) and after (black) bath application of CNQX. Stimulation of alveus‐induced action potential (AP) bursts following excitatory postsynaptic potential (EPSP) summation in the CA3‐PC under whole‐cell recording. Note that both EPSPs and AP bursts were abolished by bath application of CNQX, indicating that antidromic firings of CA3 neurons activated A/C synaptic inputs to the CA3‐PC under whole‐cell recording, which caused AP bursts. Inset, the same EPSPs evoked by first a few stimuli in an expanded scale. Scale bars, 100 ms and 10 mV. Ab, distribution of rise‐time for alveus‐evoked and MF‐evoked EPSCs. Rise‐time of EPSC evoked by alveus stimulation (red) was distinctly slower compared to that of MF‐evoked EPSCs (blue). Inset, representative EPSC traces evoked by MF or alveus stimulation. B and C, all experiments were performed in the presence of 5 mm GSH in the patch pipette. GSH‐ICS, GSH intracellular solution. For comparison Gin or PP‐EPSP amplitudes measured without intracellular GSH were reproduced as grey open symbols from Eom et al. (2019) in each panel. Ba‐Bb, baseline‐normalized Gin (filled circles) changes caused by MF conditioning at 0 min (blue arrowhead) and by somatic AP bursts at 15 min (red arrowhead) evoked by alveus stimulation at 20 Hz for 0.5 s (A/C stimulation; seven neurons from seven slices in four animals, 0 vs. 15 min, P < 0.001; 0 vs. 30 min, P = 0.234; 15 vs. 30 min, P < 0.001, Ba) or direct somatic injection of current pulses at 100 Hz for 1 s (seven neurons from seven slices in three animals, 0 vs. 15 min, P < 0.001; 0 vs. 30 min, P = 0.914; 15 vs. 30 min, P < 0.001, Bb). Left inset in Ba, representative voltage response to MF conditioning. Middle in Ba and left insets in Bb, AP bursts induced by A/C stimulation (Ba) or somatic current injection (Bb). Right insets, voltage responses to somatic subthreshold current injection (+10 and −30 pA) for measuring Gin. The time points when these voltage responses were measured are indicated by asterisks of the same colour codes (black, baseline; blue, at 15 min; red, at 30 min). Bc, same as Bb but in the presence of extracellular ZnCl2 (100 nm), which was bath‐applied 10 min after MF conditioning (horizontal bar). Note that somatic AP bursts did not trigger depotentiation of MF‐induced LTP‐IE in the presence of 100 nm ZnCl2 (five neurons from five slices in three animals, 0 vs. 15 min, P < 0.001; 0 vs. 30 min, P < 0.001; 15 vs. 30 min, P = 0.663). Bd, summary for normalized Gin at the baseline, 15 min after MF conditioning, 15 min after the depotentiating stimulation (time, F(2,32) = 61.573, P < 0.001; stimuli, F(2,16) = 1.131, P = 0.347; stimuli × time, F(4,32) = 11.887, P < 0.001; general linear model (GLM) and simple effect analysis). Ca‐Cb, baseline‐normalized peak amplitudes of PP‐EPSP changes caused by MF conditioning at 0 min (blue arrowhead) and by somatic AP bursts at 15 min (red arrowhead) evoked by A/C stimulation (seven neurons from seven slices in three animals, 0 vs. 15 min, P = 0.025; 0 vs. 30 min, P = 0.776; 15 vs. 30 min, P = 0.008, Ca) or direct somatic stimulations at 100 Hz (seven neurons from seven slices in three animals, 0 vs. 15 min, P = 0.007; 0 vs. 30 min, P = 0.604; 15 vs. 30 min, P = 0.002, Ca). Blue arrowheads, MF conditioning at 0 min. Red arrowheads, second conditioning by CA3 alveus (Ca) or somatic (Cb) stimulations at 15 min. Insets, representative traces for PP‐EPSPs recorded at time points indicated by asterisks with the same colour codes. Cc, summary for the PP‐EPSP amplitudes at baseline, 15 min after MF conditioning, 15 min after the second conditioning (time, F(2,24) = 19.343, P < 0.001; stimuli, F(1,12) = 0.008, P = 0.928; stimuli × time, F(2,24) = 0.270, P = 0.765; GLM and simple effect analysis). [Colour figure can be viewed at wileyonlinelibrary.com]
Figure 6
Figure 6. Restoration of mossy fibre (MF)‐induced potentiation of PP‐evoked field excitatory postsynaptic potentials (PP‐fEPSPs) by A/C stimulation
Aa, IR‐DIC image for extracellular recording setup. The recording electrode was placed on stratum lacunosum‐moleculare (SLM) of the CA3. Three stimulating electrodes were placed on the SLM of CA1 and subiculum border, granule cell layer of dentate gyrus and alveus of CA3 to stimulated PP, MF and A/C fibres, respectively. The silhouette of each glass electrode is indicated by a black continuous line. Scale bar, 500 µm. Ab, Upper, representative traces of fEPSPs evoked by paired pulse stimulation of PP (PP‐fEPSPs, 100 ms interval) with gradually increasing intensity ranging from 10 to 70 V. Middle, MF‐evoked fEPSP. Lower, A/C‐evoked fEPSP trace. Because all field recordings were performed at SLM of the CA3 region, only PP‐fEPSPs showed downward deflection in contrast to the upward deflection of MF‐fEPSPs (blue) and MF‐fEPSPs (red) with smaller peak amplitudes. The same colour codes were used as in Aa. Ac–Ad, mean peak amplitude (Ac) and initial slope of PP‐fEPSP (Ad) as a function of stimulation intensity. Ae, PP‐fEPSP latency (time from PP stimulation to the peak of PP‐fEPSP) was not affected by stimulus intensity (linear regression slope, t = −0.02, P = 0.98, n = 5). Af, bath application of DCG‐IV attenuated the PP‐fEPSP amplitudes (n = 5, t = 5.075, P = 0.007; paired t test). Ba and Bc, PP‐fEPSP traces (paired pulse stimulation, 100 ms interval) measured at time points indicated by asterisks in Bb (black, baseline (−5 min); blue, after MF conditioning (+40 min); red, after A/C conditioning +80 min)) under the control conditions (Ba) and the zinc conditions (100 nm ZnCl2 in the bath, Bc). Traces in grey dotted boxes are expanded and shown in right insets. Bb, peak amplitudes of first PP‐fEPSP before and after MF conditioning (blue arrowhead) and A/C conditioning (red arrowhead at 40 min) in the control (open symbols) and the zinc conditions (blue filled symbols). The PP‐fEPSPs increased and reached a plateau in 5 min post‐MF conditioning. The PP‐fEPSP stayed increased up to 40 min and was restored to the baseline by A/C conditioning. Horizontal bar, a period when 100 nm ZnCl2 was bath‐applied for the zinc condition. Asterisks, time points at which fEPSP traces of Ba and Bc were recorded (same colour codes as Ba and Bc). Bd, summary for the peak amplitudes of PP‐fEPSPs before (−5 min) and after MF (40 min) and A/C conditioning (80 min) (time, F(2,18) = 17.823, P < 0.001; Cond, F(1,9) = 4.063, P = 0.075; Cond × time, F(2,18) = 8.189, P = 0.003; baseline, P = 0.417; after MF conditioning, P = 0.067; after A/C conditioning, P = 0.025; RM‐ANOVA and simple effect analysis). Ca, neither the slope of the first PP‐fEPSP nor paired pulse ratio (PPR) measured from the peak amplitudes of first and second PP‐fEPSPs were affected by the MF and A/C conditioning. Cb, summary for the slope of PP‐fEPSPs at the baseline, after MF conditioning and after A/C conditioning (time, F(1,9) = 0.460, P = 0.639; Cond, F(1,9) = 0.088, P = 0.773; Cond × time, F(2,18) = 0.442, P = 0.649). [Colour figure can be viewed at wileyonlinelibrary.com]
Figure 7
Figure 7. The somatic or MF conditioning lowers the threshold for homosynaptic induction of LTP of PP‐EPSCs (PP‐LTP) in CA3‐PCs
Whole‐cell patch recordings were done using GSH‐free patch pipette solution. Aa and Ba, baseline‐normalized amplitudes of PP‐EPSPs (evoked every 10 s) were monitored before and after high‐frequency stimulation of PP‐CA3 synapses (PP‐HFS, red arrow) with weak (Aa) or strong (Ba) stimulation intensity. PP‐HFS comprises 10 bursts every 10 s, and each burst of 20 stimuli at 100 Hz. The stimulation intensity was quantified by the baseline PP‐EPSC amplitude (weak, <12.55 pA; strong, >12.55 pA). Upper red traces show voltage responses to PP‐HFS. A single burst response was annotated as a grey box and shown in the expanded time scale on the right. Note that weak PP‐HFS induced neither APs (Aa) nor PP‐LTP, whereas somatic APs were evoked during strong PP‐HFS (Ba). EPSP amplitudes of non‐failure events were normalized to the baseline value in the same neuron. Recording times for the representative EPSC and EPSP traces (insets) are denoted in the main graph by the numbers (black, control; red, 30 min after PP‐HFS). Ab and Bb, mean amplitudes of PP‐EPSC and PP‐EPSP before and 30 min after PP‐HFS in cases of PP‐LTP induction failure (Ab) and in cases when LTP was induced (Bb). C, plot of potentiation ratio of PP‐EPSCs induced by PP‐HFS as a function of the baseline EPSC amplitude, which is a metric of PP stimulation intensity. PP‐LTP was induced in naïve CA3‐PCs (grey symbols) and in CA3PCs that underwent MF (red) or somatic (blue) conditioning delivered before PP‐HFS. A logistic function (baseline: 108.14% ± 16.8%, max: 201.75% ± 29.6%, slope: 0.35578 ± 0.734, EPSC50 = 13.077 ± 0.635 pA) was fitted to the LTP level of naïve CA3‐PCs. Da, voltage responses to weak PP‐HFS in the CA3‐PCs which underwent MF (upper, red) or somatic conditioning (lower, blue). The response to a single burst stimulation annotated as grey box is shown in the expanded time, in the right of each voltage responses. Db, PP‐EPSC amplitude changes caused by MF or somatic conditioning (blue arrowhead) and subsequent PP‐HFS (indicated by grey arrow at 0 min). Note that PP‐LTP is readily induced by weak PP‐HFS once the CA3‐PC underwent MF (red symbols) or somatic (blue symbols) conditioning. Numbers (‘1’, ‘2’ and ‘3’) indicate time points at which traces for Gin, EPSP and EPSC were recorded, as shown in Dc and Fa. Dc, representative traces of PP‐EPSCs (left) and PP‐EPSPs (right) recorded at the time points as indicated by the numbers in Db (black, baseline; blue, after MF (upper) or somatic (lower) conditioning; red, after PP‐HFS). Note that MF or somatic conditioning enhanced PP‐EPSPs but not PP‐EPSCs, whereas both were enhanced by PP‐HFS. Ea‐Eb, mean amplitudes of PP‐EPSCs measured at the baseline, after MF (Ea) or somatic (Eb) conditioning and after PP‐HFS (conditioning: F(1,19) = 0.065, P = 0.802, time: F(1,19) = 74.965, P < 0.001, time × conditioning: F(1,19) = 0.012, P = 0.915; GLM and simple effect analysis). Ec, Ed, mean amplitudes of PP‐EPSPs measured at the baseline, after MF (Ec) or somatic conditioning (Ed) and after PP‐HFS (conditioning: F(1,19) = 3.856, P = 0.064, time: F(1,19) = 11.858, P < 0.001, time × conditioning: F(1,19) = 0.886, P = 0.358; GLM and simple effect analysis). Fa, representative voltage responses to somatic current injection of +10 and −30 pA at baseline (black), after MF conditioning (blue) and after PP‐HFS (red) in the GSH free conditions. Fb, summary for the mean amplitudes of Gin (baseline vs. post‐conditioning, P = 0.012; post‐conditioning vs. post‐HFS, P = 0.031; baseline vs. post‐HFS, P = 0.007; F(1,7) = 84.592, RM‐ANOVA). [Colour figure can be viewed at wileyonlinelibrary.com]
Figure 8
Figure 8. MF‐induced LTP‐IE is terminated after homosynaptic PP‐LTP
Whole‐cell recordings of CA3‐PCs was done using GSH‐ICScontaining pipette solution. Aa, baseline‐normalized amplitudes of PP‐EPSPs were increased by MF conditioning (20 Hz MF stimulation for 2 s, blue arrow) and further by high‐frequency stimulation of PP (PP‐HFS) with weak stimulation intensity (red arrow). Insets, representative traces of PP‐EPSPs (upper), PP‐EPSCs (lower) and before (black) and after MF conditioning (blue) and after PP‐HFS (red). The recording time points are indicated by numbers in the main graph. Ab, representative traces for voltage response to MF conditioning. Ac, voltage response to weak PP‐HFS (10 bursts every 10 s, 20 pulses at 100 Hz per a burst; baseline EPSC < 12.55 pA). Inset, grey boxed region in an expanded time scale. Ba, baseline‐normalized Gin was decreased by MF conditioning (blue arrow) and restored by PP‐HFS (red arrow). Gin was monitored in the same cells as in Aa (F(1,4) = 24.064, P < 0.001; RM‐ANOVA). Bb, Upper, representative voltage responses to somatic current injection of +10 and −30 pA at baseline (black, ‘1’), after MF conditioning (blue, ‘2’) and after PP‐HFS (red, ‘3’). Lower, mean Gin at baseline, 6 min after MF conditioning and 25 min after PP‐HFS. Baseline vs. post‐MF conditioning, P < 0.001; baseline vs. post‐PP‐HFS, P = 1.00; post‐conditioning vs. post‐PP‐HFS, P < 0.001 (n = 7, GLM and simple effect analysis). Ca, summary for the mean amplitudes of PP‐EPSPs (left, F(1,4) = 138.09, P < 0.001; RM‐ANOVA) and PP‐EPSCs (right, F(1,4) = 35.751, P < 0.001; RM‐ANOVA) at baseline, after MF conditioning and after PP‐HFS. For EPSP baseline vs. post‐MF conditioning, P < 0.001; baseline vs. post‐PPHFS, P < 0.001; post‐MF conditioning vs. post‐PPHFS, P < 0.001; (seven neurons from seven slices in four animals, GLM and simple effect analysis). For EPSCs baseline vs. post‐MF conditioning, P = 0.647; baseline vs. post‐PPHFS, P < 0.001; post‐MF conditioning vs. post‐PPHFS, P < 0.001 (seven neurons from seven slices in four animals, GLM and simple effect analysis); Cb, scatter plot for PP‐EPSP vs. PP‐EPSC measured in the same CA3‐PCs at baseline (open circles), after MF conditioning (blue triangles) and after PP‐HFS (red dots) (seven neurons from seven slices in four animals, GLM and simple effect analysis). [Colour figure can be viewed at wileyonlinelibrary.com]

References

    1. Aoyama, K. (2021). Glutathione in the brain. International Journal of Molecular Sciences, 22(9), 5010. - PMC - PubMed
    1. Berman, J. M. , & Awayda, M. S. (2013). Redox artifacts in electrophysiological recordings. American Journal of Physiology‐Cell Physiology, 304(7), C604–C613. - PMC - PubMed
    1. Chiarugi, P. , & Giannoni, E. (2005). Anchorage‐dependent cell growth: Tyrosine kinases and phosphatases meet redox regulation. Antioxidants & Redox Signaling, 7, 578–592. - PubMed
    1. Cudmore, R. H. , Fronzaroli‐Molinieres, L. , Giraud, P. , & Debanne, D. (2010). Spike‐time precision and network synchrony are controlled by the homeostatic regulation of the D‐type potassium current. Journal of Neuroscience, 30(38), 12885–12895. - PMC - PubMed
    1. Davis, M. J. , Wu, X. , Nurkiewicz, T. R. , Kawasaki, J. , Gui, P. , Hill, M. A. , & Wilson, E. (2001). Regulation of ion channels by protein tyrosine phosphorylation. American Journal of Physiology‐Heart and Circulatory Physiology, 281(5), H1835–H1862. - PubMed

LinkOut - more resources