. 2025 Aug;12(30):e03647.
doi: 10.1002/advs.202503647. Epub 2025 Jun 19.

DDAH1 Promotes Cisplatin Chemoresistance in Patients with Locally Advanced Nasopharyngeal Carcinoma via the EGFR-JAK2-STAT3 Pathway

Affiliations

DDAH1 Promotes Cisplatin Chemoresistance in Patients with Locally Advanced Nasopharyngeal Carcinoma via the EGFR-JAK2-STAT3 Pathway

Jin-Hao Yang et al. Adv Sci (Weinh). 2025 Aug.

Abstract

Cisplatin-based induction chemotherapy (IC) improves survival in patients with locally advanced nasopharyngeal carcinoma (LANPC). However, ≈30% of patients with LANPC receiving IC develop chemoresistance, and 20% experience disease progression. The relation between chemoresistance and Dimethylarginine dimethylaminohydrolase-1 (DDAH1) in NPC has not been mentioned in previous studies. To explore the regulatory mechanism and biological function of DDAH1 in cisplatin chemoresistance, NPC cell lines are subjected to overexpression and knockdown of DDAH1 in vitro, with findings further corroborated by in vivo chemosensitivity assays. The predictive value of DDAH1 expression is evaluated for survival and resistance to cisplatin-based IC in a cohort of 339 patients with LANPC. Overexpression of DDAH1 in NPC cell lines increases cisplatin resistance both in vitro and in vivo through binding to the intracellular domain of epidermal growth factor receptor (EGFR), enhancing its dimerization and phosphorylation, thereby promoting the activation of the JAK2-STAT3 pathway, which is dependent on EGFR and extracellular ligands and can be weakened by nimotuzumab. Clinically, DDAH1 positivity correlates with unfavorable 3-year survivals. This study identified DDAH1 as a prognostic marker and a potential therapeutic target for nimotuzumab to overcome treatment failure and chemoresistance in LANPC and other EGFR-positive cancers.

Keywords: DDAH1; EGFR; JAK2‐STAT3 pathway; cisplatin resistance; nasopharyngeal carcinoma; nimotuzumab.


Conflict of interest statement

The authors declare no conflict of interest.

Figures
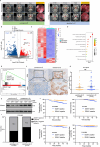
Figure 1
Figure 1
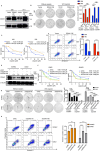
DDAH1 is associated with cisplatin resistance and poor prognosis in patients with locally advanced nasopharyngeal carcinoma (LANPC). A), Typical magnetic resonance imaging (MRI) photos of pretreatment and post‐IC of patients with LANPC resistant and sensitive to induction chemotherapy (IC). “T1W” is abbreviation of “T1‐weighted image”; “T1+C” is an abbreviation of “T1‐weighted contrast‐enhanced image”; “T2W” is abbreviation of “T2‐weighted image”. B, C), Volcano plot and heatmap show that DDAH1 is one of the upregulated genes by comparing three patients with LANPC resistant to IC with the three patients sensitive to IC. D), Bubble diagram of Kyoto Encyclopedia of Genes and Genomes (KEGG) analysis of differentially expressed genes reveals tumor‐related pathways. E), Gene set enrichment (GSEA) analysis indicates that cisplatin resistance is affected by DDAH1 expression. F), Immunohistochemical (IHC) characteristics of DDAH1 in patients with LANPC resistance and sensitive to IC. Scale bar, 100 µm. G), IHC score of DDAH1 in patients with LANPC resistant and sensitive to IC. Significance is calculated using unpaired two‐tailed Student's t‐test, ** p < 0.01. H), Western blot analyses show the expression of DDAH1 in tissue samples of three patients with LANPC sensitive to IC and three patients resistant to IC. I), Comparison of the percentage of patients that are DDAH1‐negative or ‐positive in patients with LANPC sensitive and resistant to IC. P value is calculated by chi‐square test. J), 3‐year progression‐free survival (PFS), 3‐year overall survival (OS), 3‐year recurrence‐free survival (RFS) and 3‐year distant metastasis‐free survival (DMFS) for DDAH1‐positive and ‐negative groups of the 339 patients with LANPC. P values are calculated by log‐rank test.
Figure 2
Figure 2
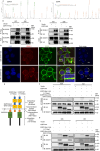
DDAH1 is associated with cisplatin resistance in NPC cell lines. A), Western blot analyses show the expression of DDAH1 in S26 and HK1 NPC cell lines with DDAH1 overexpression plasmid and empty vector plasmid as control. B), Quantified results of colony formation assays in S26 and HK1 cell lines with DDAH1 overexpression and empty vector plasmids treated with cisplatin at 4 µm for 36 h and PBS as control. The data are presented as mean ± SD and are representative of three independent experiments. Significances are calculated by one‐way ANOVA with Tukey's multiple comparisons. NS, no significance, *** p < 0.001, **** p < 0.0001. “OE” is the abbreviation for “DDAH1‐OE”. C), Cell Counting Kit 8 (CCK8) analysis for S26 and HK1 cell lines expressing DDAH1 overexpression plasmid (and empty vector) after treatment with cisplatin at the indicated concentrations (0, 4, 8, 16, and 32 µm) for 36 h. The data are presented as mean ± SD and are representative of three independent experiments. D), Flow cytometry analysis for S26 and HK1 cell lines expressing DDAH1 overexpression plasmid (and empty vector) after treatment with cisplatin at 8 µm for 36 h. The data are presented as mean ± SD and are representative of three independent experiments. Significances are calculated using unpaired two‐tailed Student's t‐test, **** p < 0.0001. E), Western blot analyses show the expression of DDAH1 in SUNE2 and CNE2 cell lines with DDAH1 knockdown and shNC as control. F), CCK8 analysis for SUNE2 and CNE2 cell lines with DDAH1 knockdown (and shNC as control) after treatment with cisplatin at the indicated concentrations (0, 4, 8, 16, and 32 µm) for 36 h. The data are presented as mean ± SD and are representative of three independent experiments. G), Quantified results of colony formation assays in CNE2 and SUNE2 cell lines with DDAH1 knockdown and shNC treated with cisplatin at 6 µm for 36 h and PBS as control. The data are presented as mean ± SD and are representative of three independent experiments. Significances are calculated by one‐way ANOVA with Tukey's multiple comparisons. **** p < 0.0001. H, Flow cytometry analysis for SUNE2 and CNE2 cell lines with DDAH1 knockdown and shNC after treatment with cisplatin at 6 µm for 36 h. The data are presented as mean ± SD and are representative of three independent experiments. Significances are calculated by one‐way ANOVA with Tukey's multiple comparisons. *** p < 0.001, **** p < 0.0001.
Figure 3
Figure 3
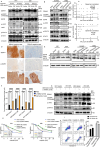
Overexpression of DDAH1 enhances stemness of NPC cell lines and confers resistance to cisplatin by activating the JAK2‐STAT3 pathway. A), DDAH1 affects cell stemness based on GSEA. B), Sphere formation assay of S26 and HK1 cell lines with DDAH1 overexpression plasmid (and empty vector plasmid is set as control). Scale bar, 100 µm. The data are presented as mean ± SD and are representative of 5 independent experiments. Diameters of spheres are shown. Significances are calculated by unpaired two‐tailed Student's t test, **** p < 0.0001. C), Side population (SP) cells are detected in S26 and HK1 cell lines with the DDAH1 overexpression plasmid (and empty vector plasmid is set as control). The data are presented as mean ± SD and are representative of three independent experiments. Significances are calculated by one‐way ANOVA with Tukey's multiple comparisons. **** p < 0.0001. “OE” is the abbreviation for “DDAH1‐OE”. D), Western blot analyses show the expression of Sox2, Oct4, and Nanog in S26 and HK1 NPC cell lines expressing DDAH1 overexpression plasmid (and empty vector plasmid is set as control). E), GSEA shows that DDAH1 affects JAK‐STAT and STAT3 related pathways in the S26 cell line expressing the DDAH1 overexpression plasmid and empty vector plasmid. F, Western blot analyses show the expression of p‐JAK2, p‐STAT3, JAK2, and STAT3 in S26 and HK1 cell lines expressing DDAH1 overexpression plasmid (and empty vector). G), IF shows the location of p‐STAT3 in S26 and HK1 cell lines expressing DDAH1 overexpression plasmid (and empty vector). Scale bar, 10 µm. H), Flow cytometry analysis for S26 cell line expressing DDAH1 overexpression plasmid treated with cisplatin at 8 µm for 36 h plus PBS for 2 h and cisplatin at 8 µm for 36 h plus TG101209 1 µm for 2 h. The data are presented as mean ± SD and are representative of three independent experiments. Significances are calculated by unpaired two‐tailed Student's t test, **** p < 0.0001. I), Western blot analyses show the expression of p‐JAK2, p‐STAT3, JAK2, STAT3, Sox2, Oct4, and Nanog in S26 and HK1 cell lines with DDAH1 overexpression plasmid (and empty vector plasmid is set as control) treated with TG101209 at 1 µm for 0 and 2 h. “OE” used in the figure is an abbreviation for “DDAH1‐OE”.
Figure 4
Figure 4
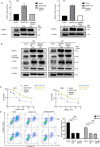
DDAH1 interacts with the intracellular domain of EGFR in NPC cell lines. A), Mass spectrometry (MS) detection shows the peptide plot of DDAH1 and EGFR. B), Lysates from wildtype S26 and HK1 cell lines transfected with plasmids expressing DDAH1‐Flag are immunoprecipitated with an anti‐Flag antibody and subjected to western blot analysis. C), Lysates from wildtype S26 and HK1 cell lines transfected with plasmids expressing EGFR‐HA are immunoprecipitated with an anti‐HA antibody and subjected to western blot analysis. D), IF showing the location and combination of EGFR and DDAH1 in S26 and HK1 cell lines expressing DDAH1 overexpression plasmid. Scale bar, 10 µm. E), Schematic illustration of the EGFR domain deletion construct used in F,G). F, Lysates from wildtype S26 and HK1 NPC cell lines transfected with plasmids expressing EGFR‐HA, EGFR‐Mutation‐1‐HA (EGFR‐Mut‐1‐HA in the figure), and EGFR‐Mutation‐2‐HA (EGFR‐Mut‐2‐HA in the figure) are immunoprecipitated with an anti‐DDAH1 antibody and subjected to western blot analysis. G), Lysates from wildtype S26 and HK1 NPC cell lines transfected with plasmids expressing EGFR‐HA, EGFR‐Mutation‐1‐HA (EGFR‐Mut‐1‐HA in the figure), and EGFR‐Mutation‐2‐HA (EGFR‐Mut‐2‐HA in the figure) are immunoprecipitated with an anti‐HA antibody and subjected to western blot analysis.
Figure 5
Figure 5
DDAH1 enhances cisplatin resistance and the JAK2‐STAT3 pathway via phosphorylation of EGFR in NPC cell lines independent of intracellular NO concentration. A), Western blot analyses show the expression of DDAH1, p‐EGFR (TYR1068), p‐JAK2, p‐STAT3, JAK2, and STAT3 in S26 and HK1 cell lines expressing the DDAH1 overexpression plasmid (and empty vector) after using AG1478 at 800 nmol L−1 for 6 h, and without using AG1478 is set as control. “OE” is an abbreviation for “DDAH1‐OE”. B), Western blot analyses show the expression of DDAH1, p‐EGFR (TYR1068), p‐JAK2, p‐STAT3, JAK2, and STAT3 in SUNE2 and CNE2 cell lines with DDAH1 knockdown and shNC is set as control. C), Spearman correlation analysis for the relation between the expression of DDAH1 and EGFR, and the relation between the expression of DDAH1 and p‐EGFR. D), IHC characteristics of DDAH1, EGFR and p‐EGFR (TYR1068) in LANPC patients with positive DDAH1 and negative DDAH1 expressions. Scale bar, 100 µm. E), Western blot analyses show the expression of EGFR dimer and monomer by cross‐linking in S26 and HK1 cell lines expressing DDAH1 overexpression plasmid (and empty vector), and in SUNE2 and CNE2 cell lines with DDAH1 knockdown and shNC is set as control. “OE” is an abbreviation for “DDAH1‐OE.” The fold changes are for EGFR monomers and dimers and are normalized by α‐tubulin. F), Concentrations of nitrite in S26 and HK1 NPC cell lines expressing DDAH1 overexpression plasmid (and empty vector) in L‐NMMA, DETA/NO and control groups. L‐NMMA is treated at 2 mm for 1 h. DETA/NO is treated at 1 mm for 24 h. The data are presented as mean ± SD and are representative of three independent experiments. Statistical significances are determined by using one‐way ANOVA with Tukey's multiple comparisons. **** p < 0.0001. G), Western blot analyses show the expression of p‐EGFR, p‐JAK2, and p‐STAT3 in HK1 NPC cell lines expressing DDAH1 overexpression plasmid (and empty vector) treated without DETA/NO or with DETA/NO at 1 mm for 24 h, and without L‐NMMA or with L‐NMMA at 2 mm for 1 h. “OE” is an abbreviation for “DDAH1‐OE”. H), CCK8 analysis in HK1 and S26 cell lines expressing DDAH1 overexpression plasmid (and empty vector) in cisplatin plus PBS and cisplatin plus L‐NMMA, cisplatin is treated at the indicated concentrations (0, 4, 8, 16, and 32 µm) for 36 h, L‐NMMA is treated at 2 mm for 1 h. The data are presented as mean ± SD and are representative of three independent experiments. I), Flow cytometry analysis for HK1 and S26 cell lines expressing DDAH1 overexpression plasmid after treatment with cisplatin plus PBS and cisplatin plus L‐NMMA. Cisplatin is treated at 8 µm for 36 h. L‐NMMA is treated at 2 mm for 1 h. “OE” is an abbreviation for “DDAH1‐OE.” The data are presented as mean ± SD and are representative of three independent experiments. Statistical significances are determined by using unpaired two‐tailed Student's t test. NS, no significance.
Figure 6
Figure 6
DDAH1 enhances cisplatin resistance and the JAK2‐STAT3 pathway via phosphorylation of EGFR in NPC cell lines independent of DDAH1 enzyme activity. A), DDAH1 relative activity of DDAH1 overexpression and mutated DDAH1 for S26 and HK1 NPC cell lines, vector is set for control. Western blot analyses show the expression of DDAH1 in S26 and HK1 NPC cell lines. B), Western blot analyses show the expression of p‐EGFR (TRY1068), p‐JAK2, p‐STAT3 in S26 and HK1 NPC cell lines with vector, DDAH1 overexpression and mutated DDAH1. C), CCK8 analysis for S26 and HK1 cell lines with vector, DDAH1 overexpression and mutated DDAH1 after treatment with cisplatin at the indicated concentrations (0, 4, 8, 16, and 32 µm) for 36 h. The data are presented as mean ± SD and are representative of three independent experiments. D), Flow cytometry analysis for S26 and HK1 cell lines with vector, DDAH1 overexpression and mutated DDAH1 after treatment with cisplatin at 8 µm for 36 h. The data are presented as mean ± SD and are representative of three independent experiments. Significances are calculated by one‐way ANOVA with Tukey's multiple comparisons. NS, no significance, **** p < 0.0001.
Figure 7
Figure 7
DDAH1 enhances EGFR‐JAK2‐STAT3 pathways through the combination of EGFR and extracellular ligands. A), Western blot analyses show the expression of p‐EGFR, p‐JAK2, and p‐STAT3 in HK1 and S26 cell lines expressing DDAH1 overexpression plasmid (and empty vector) B), Western blot analyses show the expression of Sox2, Oct4, and Nanog in S26 and HK1 cell lines expressing DDAH1 overexpression plasmid (and empty vector). C), Western blot analyses show the expression of EGFR dimer and monomer in HK1 and S26 cell lines expressing DDAH1 overexpression plasmid (and empty vector) treated without nimotuzumab or with nimotuzumab at 200 µg mL−1 for 24 h. D), IF shows the combination and location of EGFR‐HA and EGFR‐Flag in HK1 and S26 cell lines expressing DDAH1 overexpression plasmid (and empty vector) treated with nimotuzumab for 0 h and nimotuzumab at 200 µg mL−1 for 24 h. Scale bar, 10 µm. E), CCK8 analysis in HK1 and S26 cell lines expressing DDAH1 overexpression plasmid (and empty vector), cisplatin is treated at the different concentrations m for 36 h, nimotuzumab is treated at 200 µg mL−1 for 36 h. F), Quantified results of colony formation assays in HK1 and S26 cell lines with DDAH1 overexpression plasmid (and empty vector plasmid is set as control) treated with PBS alone and cisplatin at 6 µm plus PBS for 36 h and cisplatin at 6 µm plus nimotuzumab at 200 µg mL−1 for 36 h. G), Flow cytometry analysis for HK1 and S26 NPC cell lines expressing DDAH1 overexpression plasmid (and empty vector). Cisplatin is treated at 8 µm for 36 h. Nimotuzumab is treated at 200 µg mL−1 for 36 h. "OE" is abbreviation of “DDAH1‐OE”. E), F), G) The data are presented as mean ± SD and are representative of three independent experiments. F), G) Statistical significances are determined by using one‐way ANOVA with Tukey's multiple comparisons. NS, no significance, * p < 0.05, *** p < 0.001, **** p < 0.0001.
Figure 8
Figure 8
Nimotuzumab decreases the enhancement of cisplatin resistance caused by DDAH1 in vivo and DDAH1 serves as a potential marker for the use of nimotuzumab. A), Subcutaneous injection of the S26 cell line expressing DDAH1 overexpression plasmid (empty vector plasmid is set as control) into M‐NSG mice to establish a mouse model (n = 5) treated with saline, cisplatin (4 mg kg−1) plus saline, and cisplatin (4 mg kg−1) plus nimotuzumab (20 mg kg−1). Tumor images, tumor weights, and tumor volumes are shown. Statistical significances are determined by using one‐way ANOVA with Tukey's multiple comparisons. NS, no significance, * p < 0.05, ** p < 0.01, **** p < 0.0001. B), HE and IHC staining of DDAH1, p‐EGFR, and EGFR in subcutaneous xenograft tumors from the S26 cell line expressing the DDAH1 overexpression plasmid (empty vector plasmid is set as control). Scale bar, 100 µm. C), Kaplan–Meier analysis of 3‐year progression‐free survival (PFS), overall survival (OS), recurrence‐free survival (RFS) and distant metastasis‐free survival (DMFS) in 190 DDAH1‐positive patients with LANPC treated with or without nimotuzumab. D), Kaplan–Meier analysis of 3‐year PFS, OS, RFS, and DMFS in 149 DDAH1‐negative patients with LANPC treated with or without nimotuzumab. E), The proposed mechanism model for DDAH1 function in NPC cisplatin resistance. DDAH1 binds to the intracellular domain of EGFR and promotes EGFR dimerization and phosphorylation, thus increases activation of the JAK2‐STAT3 pathway to enhance cisplatin resistance.

Similar articles

References

    1. Wong K. C. W., Hui E. P., Lo K.‐W., Lam W. K. J., Johnson D., Li L., Tao Q., Chan K. C. A., To K.‐F., King A. D., Ma B. B. Y., Chan A. T. C., Nat. Rev. Clin. Oncol. 2021, 18, 679. - PubMed
    1. Chen Y. P., Chan A. T. C., Le Q. T., Blanchard P., Sun Y., Ma J., Lancet 2019, 394, 64. - PubMed
    1. Li K., Lin G.‐Z., Shen J.‐C., Zhou Q., Asian Pac. J. Cancer Prev. 2014, 15, 9899. - PubMed
    1. Sun Y., Li W.‐F., Chen N.‐Y., Zhang N., Hu G.‐Q., Xie F.‐Y., Sun Y., Chen X.‐Z., Li J.‐G., Zhu X.‐D., Hu C.‐S., Xu X.‐Y., Chen Y.‐Y., Hu W.‐H., Guo L., Mo H.‐Y., Chen L., Mao Y.‐P., Sun R., Ai P., Liang S.‐B., Long G.‐X., Zheng B.‐M., Feng X.‐L., Gong X.‐C., Li L., Shen C.‐Y., Xu J.‐Y., Guo Y., Chen Y.‐M., et al., Lancet Oncol. 2016, 17, 1509.
    1. Zhang Y., Chen L., Hu G.‐Q., Zhang N., Zhu X.‐D., Yang K.‐Y., Jin F., Shi M., Chen Y.‐P., Hu W.‐H., Cheng Z.‐B., Wang S.‐Y., Tian Y., Wang X.‐C., Sun Y., Li J.‐G., Li W.‐F., Li Y.‐H., Tang L.‐L., Mao Y.‐P., Zhou G.‐Q., Sun R., Liu X., Guo R., Long G.‐X., Liang S.‐Q., Li L., Huang J., Long J.‐H., Zang J., et al., N. Engl. J. Med. 2019, 381, 1124. - PubMed

MeSH terms

LinkOut - more resources