

NKG7 is a Stable Marker of Cytotoxicity Across Immune Contexts and Within the Tumor Microenvironment
- PMID: 40538191
- PMCID: PMC12179582
- DOI: 10.1002/eji.202551885
NKG7 is a Stable Marker of Cytotoxicity Across Immune Contexts and Within the Tumor Microenvironment
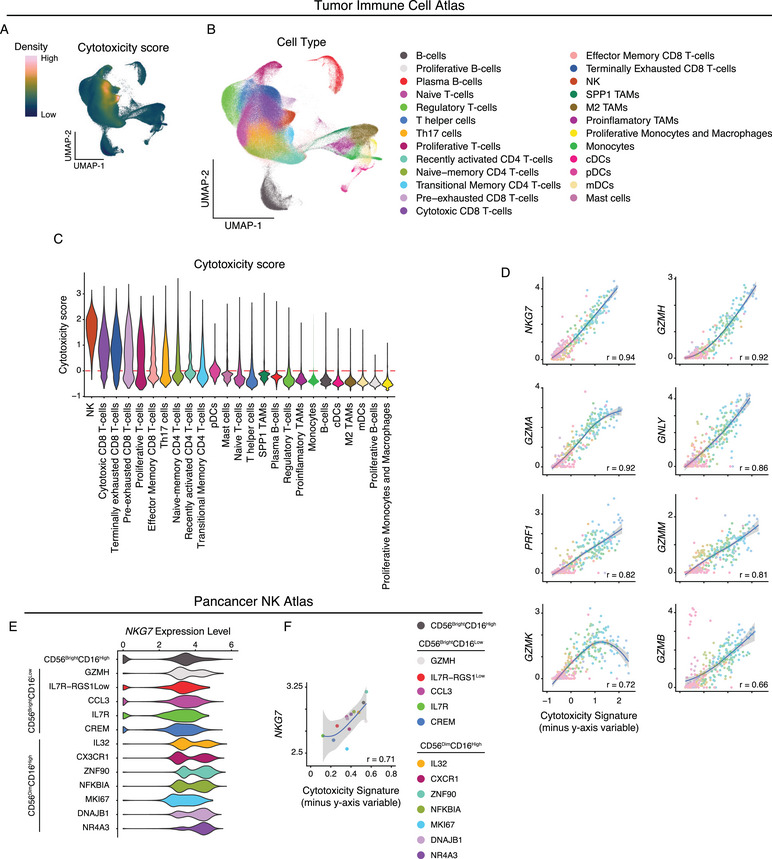
Abstract
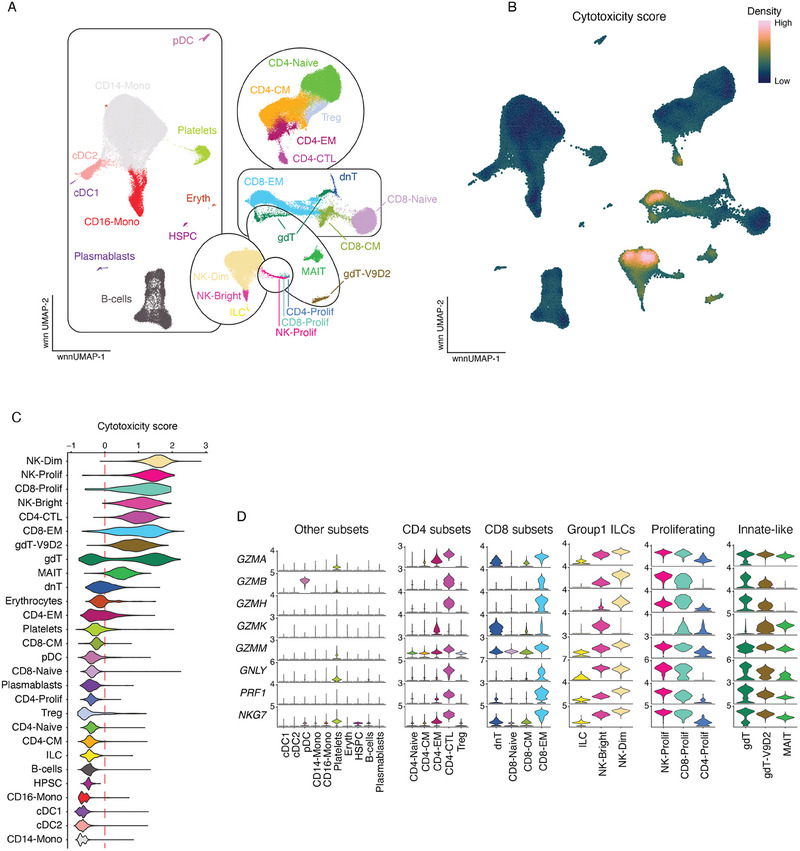
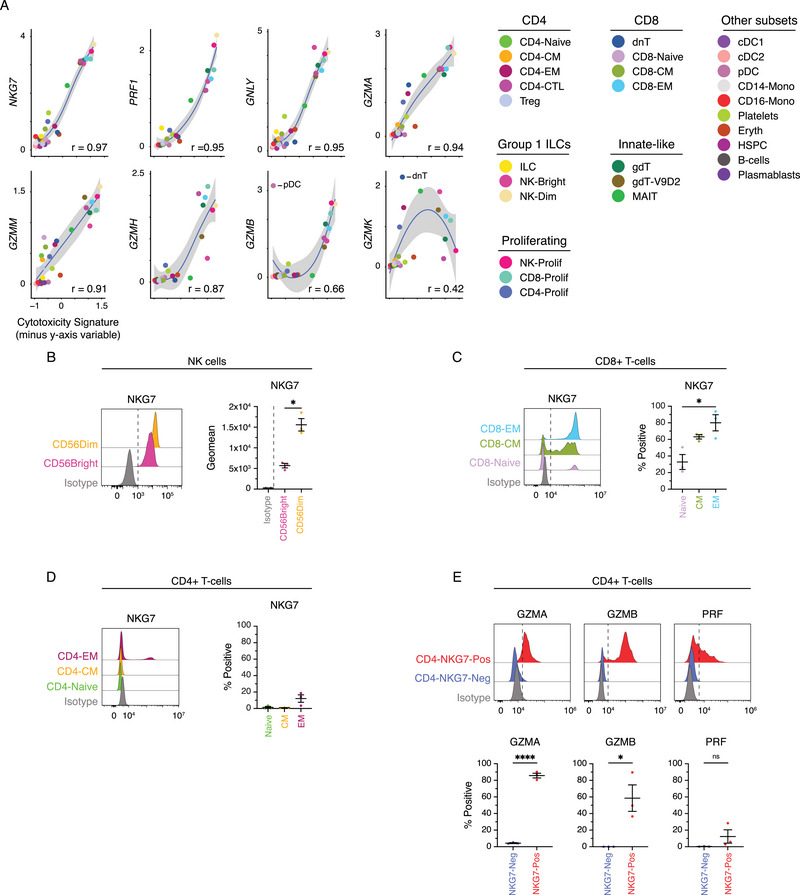
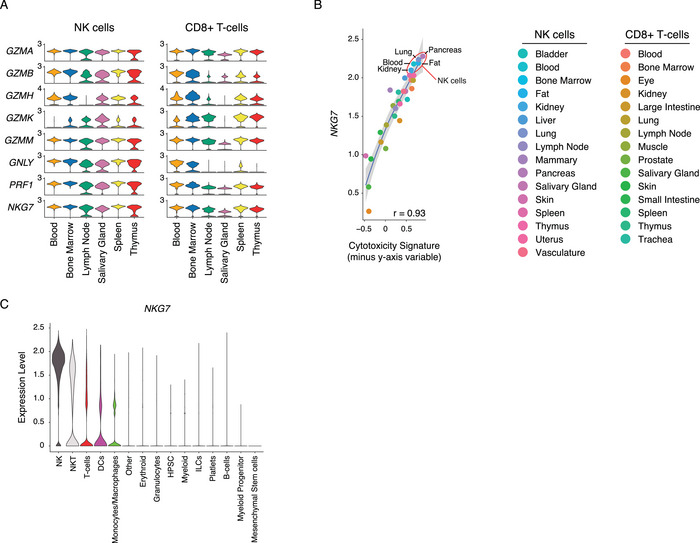
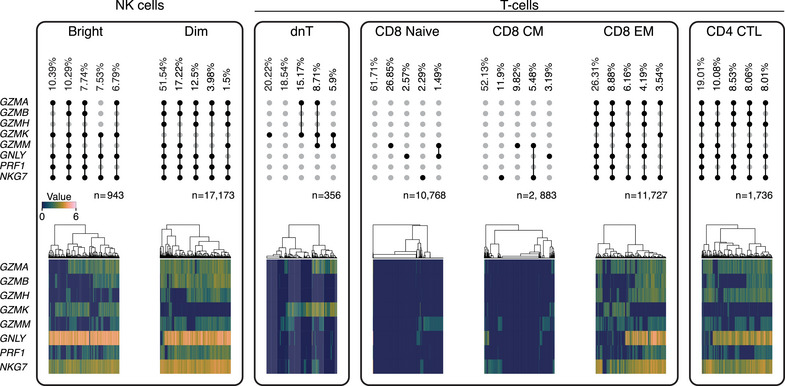
Cytotoxicity is a cornerstone of immune defense, critical for combating tumors and infections. This process relies on the coordinated action of granzymes and pore-forming proteins, with granzyme B (GZMB) and perforin (PRF1) being key markers and the most widely studied molecules pertaining to cytotoxicity. However, other human granzymes and cytotoxic components remain underexplored, despite growing evidence of their distinct, context-dependent roles. Natural killer cell granule protein 7 (NKG7) has recently emerged as a crucial cytotoxicity regulator, yet its expression patterns and function are poorly understood. Using large publicly available single-cell RNA sequencing atlases, we performed a comprehensive profiling of cytotoxicity across immune subsets and tissues. Our analysis highlights NKG7 expression as a strong marker of cytotoxicity, exhibiting a strong correlation with overall cytotoxic activity (r = 0.97) and surpassing traditional markers such as granzyme B and perforin in reliability. Furthermore, NKG7 expression is notably consistent across diverse immune subsets and tissues, reinforcing its versatility and robustness as a cytotoxicity marker. These findings position NKG7 as an invaluable tool for evaluating immune responses and a reliable indicator of cytotoxic functionality across biological and clinical contexts.
Keywords: CD8+ T‐cells; NKG7; cytotoxicity; granzyme B; natural killer cells; single‐cell RNA sequencing; tumor microenvironment.
© 2025 The Author(s). European Journal of Immunology published by Wiley‐VCH GmbH.
Conflict of interest statement
The authors declare no conflicts of interest.
Figures
References
MeSH terms
Substances
LinkOut - more resources
Full Text Sources
Medical
Research Materials
