. 2025 Aug;12(31):e05207.
doi: 10.1002/advs.202505207. Epub 2025 Jun 20.

Label-Free Single-Molecule Immunoassay

Affiliations

Label-Free Single-Molecule Immunoassay

Xiaoyan Zhou et al. Adv Sci (Weinh). 2025 Aug.

Abstract

Single-molecule immunoassay is a reliable technique for the detection and quantification of low-abundance blood biomarkers, which are essential for early disease diagnosis and biomedical research. However, current single-molecule methods predominantly rely on endpoint detection and necessitate signal amplification via labeling, which brings a variety of unwanted effects, like matrix effect and autofluorescence interference. This study introduces a real-time mass imaging-based label-free single-molecule immunoassay (LFSMiA). Featuring plasmonic scattering microscopy-based mass imaging, a 2-step sandwich assay format enables background reduction, minimization of matrix effect by dynamic tracking of single binding events, and fully leveraging real-time data for improved measurement precision through a Bayesian Gaussian process model, the LFSMiA enables ultra-sensitive and direct protein detection at the single-molecule level in neat blood sample matrices. LFSMiA measurement is demonstrated for interleukin-6 and prostate-specific antigen in buffer, undiluted serum, and whole blood with sub-femtomolar detection limits and eight logs of dynamic ranges. Moreover, comparable performance is achieved with an inexpensive miniaturized setup. To show its translational potential to clinical settings and point-of-care diagnostics, N-terminal pro-B-type natriuretic peptide is examined in patient whole blood samples using the LFSMiA and results in a strong linear correlation (r > 0.99) with standard clinical lab results.

Keywords: digital immunoassay; label‐free; plasmonic scattering microscopy; single‐molecule; whole blood.


Conflict of interest statement

The authors declare the following competing financial interest(s): S.W. is a member of the technology advisory board of Biosensing Instrument Inc. A US patent application (18/956,466) has been filed by the Arizona Board of Regents on behalf of Arizona State University based on an early draft of this article. The inventors are S.W., X.Z, and S.Z.

Figures

Figure 1
Figure 1
The principle of LFSMiA. a) Experimental setup. The analytes of interest are first pulled down by the capture antibodies tethered to the gold film via an alkane linker. A p‐polarized incident light is focused on the gold surface with an incident angle of 71° to excite SPR and the associated evanescent field. After introducing the detection antibody solution, the process of detection antibody binding to the biomarkers caught on the surface is recorded by a CMOS camera via an air objective above the microfluidic channel. b) The raw images are processed by a custom‐written algorithm to remove background noise and to extract the binding events of single particles hitting the sensor surface. A time course of the total count of the specific binding of the detection antibody is then determined and fitted with the Bayesian Gaussian process model to enhance the precision after filtering by the position, molecular weight, binding duration, and binding frequency of the detected binding events. Finally, a standard curve (binding events versus analyte concentration) is generated from triplicate tests of different analyte concentrations. More details are provided in Note S2 (Supporting Information).
Figure 2
Figure 2
Validation of LFSMiA. a) Workflow of LFSMiA. Capture antibodies were first immobilized on the gold film through an alkane linker. Analyte samples flowed through the microfluidic channel for 10 min in NT‐proBNP detection or 2 h in the other cases. A 10 nM detection antibody solution was injected for 10 min, and the binding of the detection antibody to analytes captured on the sensor surface was recorded. b) The relationship between PSM image intensity and molecular weight (MW) of particles was determined from PSM images of different proteins in PBS solution. The mean intensity of one type of protein is the mean of its Gaussian fit to the corresponding histograms in Figure S2 (Supporting Information). The error bars are the model fitting error in Figure S2 (Supporting Information). The number of total binding events over time for different IL‐6 concentrations in c) pure buffer and (d) bovine serum. For clarity, the BGP model fitted mean values (solid lines) and the posterior standard deviations (dark‐colored shadows), and the sample standard deviations from the three replicates (light‐colored shadows) are plotted. Raw data of individual measurements can be found in Figures S4,S5 (Supporting Information). e) Standard curves of IL‐6 detection in pure buffer (blue) and bovine serum (yellow). The error bars are the posterior standard deviation calculated by the BGP model. The blue and yellow dashed lines represent the LOD for pure buffer and bovine serum, respectively, defined as mean plus three times the posterior standard deviation of the blank solution signal.
Figure 3
Figure 3
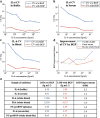
Rapid NT‐proBNP detection in human plasma and clinical evaluation. a) Temporal profiles for different NT‐proBNP concentrations in human plasma. For clarity, the BGP model fitted mean values (solid lines) and the posterior standard deviations (dark‐colored shadows), and the sample standard deviations from the three replicates (light‐colored shadows) are plotted. Raw data of individual measurements can be found in Figure S6 (Supporting Information). b) Standard curve of NT‐proBNP detection in human plasma. The error bars are the posterior standard deviation calculated by the BGP model. The dashed line represents the limit of detection for NT‐proBNP in human plasma, defined as mean plus three times the posterior standard deviations of blank solution (horse serum) signal. c) Pearson's correlation between LFSMiA and Roche's Elecsys proBNP II assay (r = 0.990). The results were determined from measurements of serum samples from 28 patients using both the Elecsys proBNP II assay and LFSMiA. d) Summary of all the measurement results for the 28 patients.
Figure 4
Figure 4
Protein detection in whole blood. Time courses of total binding events for different concentrations of a) IL‐6 and b) PSA in bovine whole blood. For clarity, the BGP model fitted mean values (solid lines) and the posterior standard deviations (dark‐colored shadows), and the sample standard deviations from the three replicates (light‐colored shadows) are plotted. Raw data of individual measurements in Figures S7,S8 (Supporting Information). Standard curve of c) IL‐6 and d) PSA in bovine whole blood. The error bars are the posterior standard deviations calculated by the BGP model. The red dashed line represents the limit of detection, defined as the mean plus three times the posterior standard deviations of the blank solution signal.
Figure 5
Figure 5
Point‐of‐Care LFSMiA and its clinical evaluation. a) Photograph of LFSMiA‐lite. b,d) are dynamic response profiles for different concentrations of IL‐6 in horse serum and NT‐proBNP in bovine whole blood, respectively. For clarity, the BGP model fitted mean values (solid lines) and the posterior standard deviations (dark‐colored shadows), and the sample standard deviations from the three replicates (light‐colored shadows) are plotted. Raw data of individual measurements can be found in Figures S21,S22 (Supporting Information). Stand curves of IL‐6 detection in horse serum c) and NT‐proBNP detection in bovine whole blood e). The error bars are the posterior standard deviations calculated by the BGP model. The dashed line represents the limit of detection, defined as the mean plus three times the posterior standard deviations of the blank solution signal. f) Pearson's correlation between NT‐proBNP concentration in patients' whole blood samples determined by LFSMiA‐lite and its corresponding serum samples measured using Roche's Elecsys proBNP II assay. Pearson's r = 0.997.
Figure 6
Figure 6
Improvement of detection limit and precision by the BGP model. a‐c) show the coefficient of variation of IL‐6 detection in pure buffer, horse serum, and bovine whole blood, determined with and without the model, respectively. d) presents the improvement of CV under different conditions by the BGP model. e) Comparison of the LOD obtained by the standard method and the BGP model under different samples and conditions.

References

    1. a) Mordente A., Meucci E., Martorana G. E., Silvestrini A., Advances in Cancer Biomarkers 2015, 9; - PubMed
    2. b) Kim S.‐H., Hoffmann U., Borggrefe M., Akin I., Behnes M., Curr. Pharm. Biotechnol. 2017, 18, 445; - PubMed
    3. c) Solier C., Langen H., Proteomics 2014, 14, 774. - PubMed
    1. a) Belanger L., Sylvestre C., Dufour D., Clin. Chim. Acta 1973, 48, 15; - PubMed
    2. b) Farajollahi M. M., Cook D. B., Hamzehlou S., Self C. H., Scandinavian Journal of Clinical and Laboratory Investigation 2012, 72, 531. - PubMed
    1. Giljohann D. A., Mirkin C. A., Nature 2009, 462, 461. - PMC - PubMed
    1. Shashkova S., Leake M. C., Biosci. Rep. 2017, 37, BSR20170031. - PMC - PubMed
    1. Rissin D. M., Kan C. W., Campbell T. G., Howes S. C., Fournier D. R., Song L., Piech T., Patel P. P., Chang L., Rivnak A. J., Ferrell E. P., Randall J. D., Provuncher G. K., Walt D. R., Duffy D. C., Nat. Biotechnol. 2010, 28, 595. - PMC - PubMed

LinkOut - more resources