. 2025 May 21;28(6):112725.
doi: 10.1016/j.isci.2025.112725. eCollection 2025 Jun 20.

Organization and development of bilateral somatosensory feedback projections in mice

Affiliations

Organization and development of bilateral somatosensory feedback projections in mice

Grace Houser et al. iScience. .

Abstract

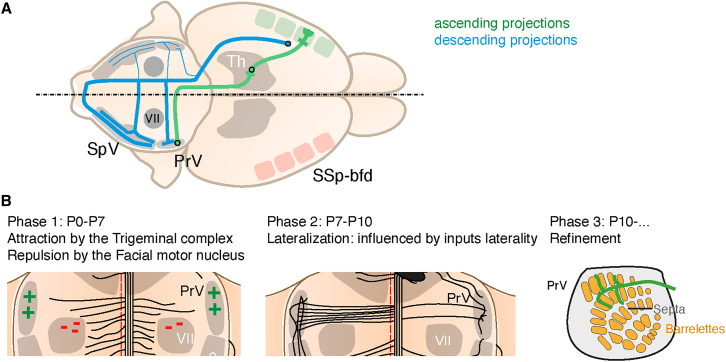
Sensory information travels from the periphery to the cortex across relays. Each of these stations receives feedback projections which gate and tune the transmission of feedforward information. We used whole brain imaging combined with viral strategies and single axon tracings to reveal the existence of a bilateral feedback projection from the somatosensory cortex to brainstem relays processing whisker information. Initially, after birth in mice, this feedback loop projects equally to both sides of the brainstem. Then, the projection strengthens preferentially toward the contralateral side while maintaining its ipsilateral component. We found that manipulating the laterality of the feedforward pathway from the brainstem to the opposite cortex altered the laterality preference of the descending feedback projections. This suggests a dynamic interplay between ascending and descending pathways in shaping sensory processing. This study highlights the presence of bilateral integration within the somatosensory system's feedback projections.

Keywords: Biological sciences; Natural sciences; Neuroanatomy; Neuroscience; Systems neuroscience.


Conflict of interest statement

Authors declare that they have no competing interests.

Figures

None
Graphical abstract
Figure 1
Figure 1
Descending axons from the barrel cortex project bilaterally to the brainstem via collaterals (A) Viral tracing for the visualization of efferent projections from the barrel cortex. iDISCO+ processed adult mouse brain, labeled for GFP (B–F), injected as in (A). (B) Oblique projection at the level of the injection site in the barrel cortex, showing labeled neurons across all cortical layers, and corticofugal axons. (C) Visualization of efferent projections from the barrel cortex: CaMKIIa-cre mice were injected with a cre-dependent AAV and processed with iDISCO+. 3D projections are shown for the GFP+ axons (red) and tissue autofluorescence for context (blue) in sagittal and horizontal orientations, showing the extent of these projections throughout the brain. (D and E) Details of the descending collaterals in the brainstem, shown in horizontal and coronal orientations. (F) TrailMap segmentation of axons, aligned to the CCFv3 reference atlas with ClearMap. Averaged density map of 7 brain shown in sagittal and coronal orientations. (G) Quantification of the laterality of axon densities in the brainstem target nuclei of the corticobulbar projection. Bilateral projections exist for each target. Only the Pontine formation (P) has a majority of ipsilateral projections, while the trigeminal complex receives for the most part contralateral inputs from the cortex. (H) Scheme of the laterality of brainstem collaterals of descending projections. Scale bars are 300 μm (B, D, and E) or 1 mm (C). Data are presented as mean ± SEM.
Figure 2
Figure 2
Bilateral collateralization of pyramidal neurons in the brainstem revealed by retrograde tracing and single axon reconstructions (A) Bilateral retrograde tracing of cortical projections to the brainstem with CTβ tracers injected at the level of the PrV nuclei. (B) 3D whole-brain scan of the traced neurons, whole brain horizontal projection (left) and detail of the barrel cortex (right): autofluorescence (gray), contralateral segmented neurons (green) and ipsilateral segmented neurons (magenta). (C) Oblique projection at the level of the barrel cortex, showing the presence of layer 5 CTβ+ cells projecting in majority to the contralateral trigeminal, but also to the ipsilateral trigeminal, and seldomly to both. (D) Use of the CART-cre line to obtain sparse labeling of layer 5 neurons in the barrel cortex. Whole brain scans of AAV-injected brains in the barrel cortex of CART-cre mice show the presence of upper-layer neurons projecting to the motor cortex and corpus callosum, and with a lesser frequency, infra-granular neurons projecting to the CST. Single axons are visible from the cortex down to the brainstem. (E) Virtual-reality assisted reconstructions of seven layer 5 neurons from the barrel cortex projecting to either ipsilateral or contralateral trigeminal nuclei, obtained from the CART-cre line, revealing the different possible trajectories of CST collaterals, as well as the presence of bilaterally projecting neurons. Scale bars are 1 mm (B, left panel) or 200 μm (all other panels).
Figure 3
Figure 3
The development of the cortifugal projection to the trigeminal complex is at first unbiased, and then biased toward the contralateral trigeminal complex (A) Experimental timeline for the developmental tracing of corticobulbar projections. (B–F) Whole brain scans of pups injected at P1 with a AAV-EF1a-GFP construct and collected at P3 (C), P5 (D), P7 (E) or P10 (F) (n = 3 for each time point, n = 4 at P5). (B) Whole brain projection of the labeled tracts (shown here at P7). (C–F) Ventral projections of the brainstem, as well as coronal projections at the level of the PrV. The averaged normalized densities of axon pixels are shown in the right panels as histograms showing the distribution of axons in the mediolateral axis. The mediolateral axis is normalized to the P10 scans to account for tissue expansion. The distributions show a clear peak at the level of the CST, and a peak at the level of the contralateral trigeminal nucleus at P7 and P10. (G) Scheme of the development of corticobulbar collaterals between P3 and P10. Scale bars are 200 μm.
Figure 4
Figure 4
Early sensory deprivation impairs the refinement of descending projections, but not their laterality (A) Experimental timeline of early deprivations and iDISCO+ processing of the GFP labeled brains. (B) Visualization of the effect of the ION lesion in the barrel cortex, showing barrel fusions. Lesioned animals with intact barrels were excluded from the analysis. Spread of labeled neurons at the injection site was verified as well. (C–E) Whole-brain scans of cortical projections to the brainstem in control (C) or P2-deprived (D and E) P30 animals. Coronal projections are shown at the level of the PrV and SpV. Projections to the intact nuclei show a distinctive intra-septal pattern, while projections to the deprived nuclei at both levels are disorganized. (F) Quantification of the laterality-bias of corticofugal axonal densities in control, ipsilateral and contralateral deprived animals. Deprivations have no effect on the laterality ratio of corticofugal projections (n = 7 and 5, p > 0.9). A Mann-Whitney test was used to calculate the significance of the mean differences. Scale bars are 200 μm.
Figure 5
Figure 5
The ipsilateral component of the corticotrigeminal projection is increased in a mouse mutant with an aberrant ipsilateral trigeminal thalamocortical pathway (A) Description of the Krox20-cre; Robo3lox/lox line: afferent projections from the PrV to the thalamic VPM are partially uncrossed. (B) Dual viral AAV injections in the barrel cortex of adult control (C and D) and Krox20-cre; Robo3lox/lox (E and F) mice. (C–F) iDISCO+ processed, GFP labeled, whole brain scans of control (C and E) and Krox20-cre; Robo3lox/lox mutant mice (D and F). Spreads of the injections targeting efferent barrel cortex pyramidal neurons sending collaterals to the ipsilateral Superior Colliculus. In both controls and mutants, labeled neurons were localized in layer 5 (C and D). In Krox20-cre; Robo3lox/lox mutants, an enrichment in ipsilateral collateral projections at the level of the PrV is observed in the horizontal projection at the level of the brainstem (E and F). (G and H) TrailMap segmentation of anterograde axons, aligned with ClearMap (colored by their anatomical location). Detail of the brainstem projections, highlighting the large ipsilateral component in mutant mice. (I) Quantification of the laterality bias in controls and Krox20-cre; Robo3lox/lox mice from TrailMap segmentations, showing a reduced laterality bias in the mutant mice (n = 7 and 5, p = 0.015). A Mann-Whitney test was used to calculate the significance of the mean differences. (J) Summary diagram of the control and Krox20-cre; Robo3lox/lox mutant organization for the laterality of corticofugal projections. Scale bars are 500 μm.
Figure 6
Figure 6
The increase of ipsilateral corticotrigeminal connectivity is visible early on by P7 in the Robo3:KroxCre mouse mutants Whole brain scans obtained from control (A) and Krox20-cre; Robo3lox/lox mice (B) injected with an AAV expressing GFP at P2, and collected at P7. (A and B) Summary of the injection sites and spreads. Owing to the small size of the brain, injections spread over most of S1. (C and D) horizontal ventral projections at the level of the brainstem in control (C) or mutant (D) mice or 100 μm-thick coronal projections at the level of the PrV (C and D). In controls, a small laterality bias is already visible, but axon densities are more evenly distributed across both sides of the midline in mutants. (E and F) Coronal projections (100 μm) at the level of the pontine region, showing the density of innervation of the PrV nucleus in control (E) and mutant (F) mice. In mutant mice, the ipsilateral PrV innervation is denser than in controls. (G) Quantification of the laterality bias in P7 controls and Krox20-cre; Robo3lox/lox mice from TrailMap segmentations, showing a reduced laterality bias in the developing mutant mice (n = 4, p = 0.019). A Mann-Whitney test was used to calculate the significance of the mean differences. Scale bars are 200 μm.
Figure 7
Figure 7
Development and organization of the corticobulbar projection (A) Summary of the developmental findings of this study. (B) Summary of the organization of the main cortico-bulbar projection and its collaterals.

Similar articles

References

    1. Lamme V.A., Supèr H., Spekreijse H. Feedforward, horizontal, and feedback processing in the visual cortex. Curr. Opin. Neurobiol. 1998;8:529–535. doi: 10.1016/s0959-4388(98)80042-1. - DOI - PubMed
    1. Deschênes M., Veinante P., Zhang Z.-W. The organization of corticothalamic projections: reciprocity versus parity. Brain Res. Rev. 1998;28:286–308. doi: 10.1016/s0165-0173(98)00017-4. - DOI - PubMed
    1. Zagha E., Casale A.E., Sachdev R.N.S., McGinley M.J., McCormick D.A. Motor Cortex Feedback Influences Sensory Processing by Modulating Network State. Neuron. 2013;79:567–578. doi: 10.1016/j.neuron.2013.06.008. - DOI - PMC - PubMed
    1. Shen S., Jiang X., Scala F., Fu J., Fahey P., Kobak D., Tan Z., Zhou N., Reimer J., Sinz F., Tolias A.S. Distinct organization of two cortico-cortical feedback pathways. Nat. Commun. 2022;13:6389. doi: 10.1038/s41467-022-33883-9. - DOI - PMC - PubMed
    1. Mazo C., Nissant A., Saha S., Peroni E., Lledo P.-M., Lepousez G. Long-range GABAergic projections contribute to cortical feedback control of sensory processing. Nat. Commun. 2022;13:6879. doi: 10.1038/s41467-022-34513-0. - DOI - PMC - PubMed

LinkOut - more resources