

Porous PLGA microspheres loaded with PTH1-34 peptide for long-term treatment of OA
- PMID: 40538640
- PMCID: PMC12178744
- DOI: 10.1016/j.jot.2025.05.003
Porous PLGA microspheres loaded with PTH1-34 peptide for long-term treatment of OA
Abstract
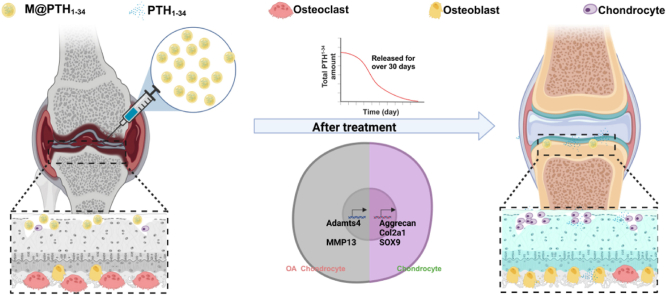
Background: Osteoarthritis (OA) is a chronic disease characterized by degeneration of articular cartilage, affecting over 530 million patients worldwide. Current oral medications such as non-steroidal anti-inflammatory drugs (NSAIDs) can only alleviate symptoms and are associated with numerous adverse effects. Although teriparatide (PTH1-34) exhibits dual functions of chondroprotection and osteogenic effects, its clinical application is significantly limited by its short biological half-life (30-60 min) and accelerated degradation within the inflammatory microenvironment of joint cavities.
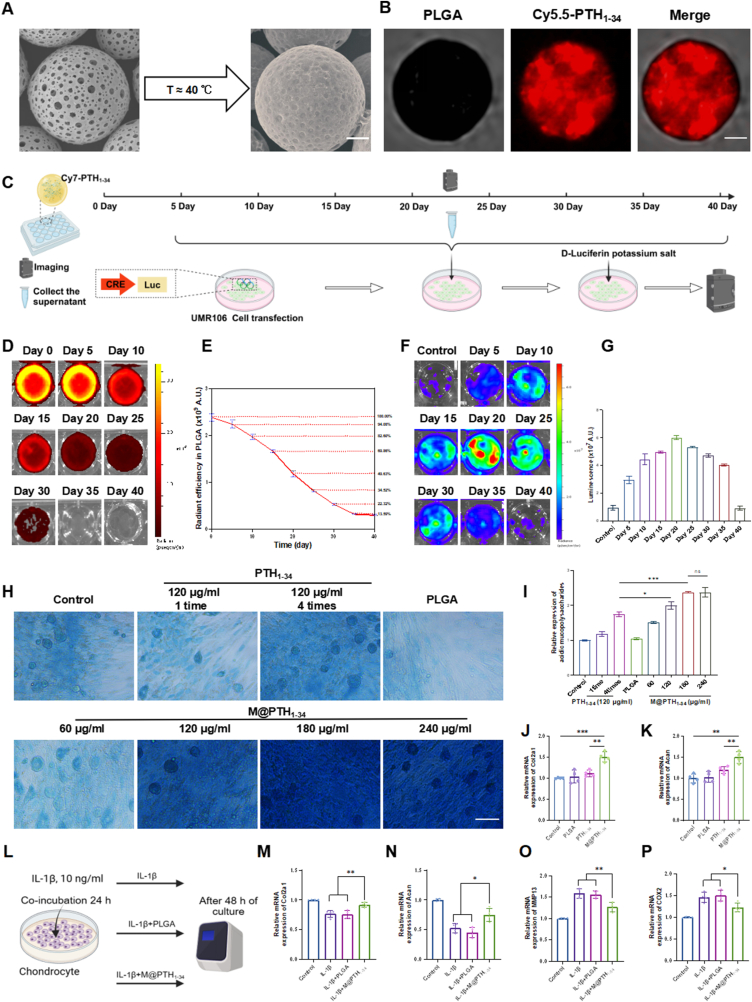
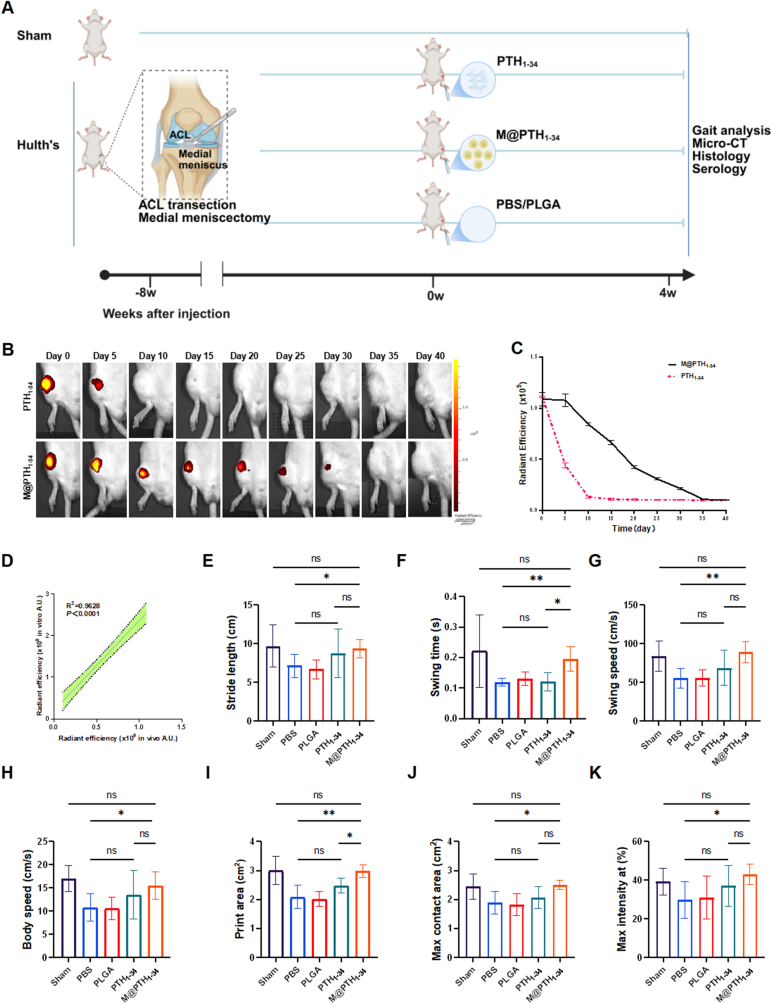
Methods: Porous sustained-release microspheres (M@PTH1-34) were fabricated using FDA-approved poly (lactic-co-glycolic acid) (PLGA) as the matrix, encapsulating PTH1-34 within their multi-channel porous structure. Uniform microsphere preparation and high-efficiency drug loading were achieved through membrane emulsification and temperature-controlled embedding techniques. To systematically evaluate the sustained-release profile and therapeutic outcomes, both in vitro and in vivo OA models were established, enabling comprehensive analysis of cartilage repair efficacy, anti-inflammatory regulation, and immunomodulatory effects.
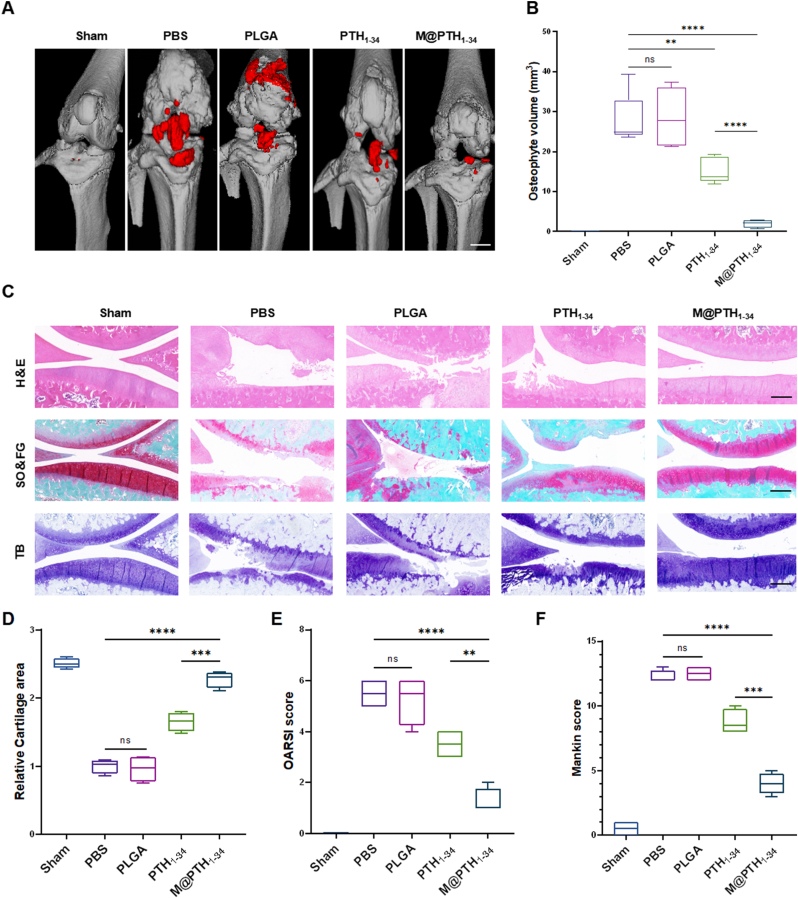
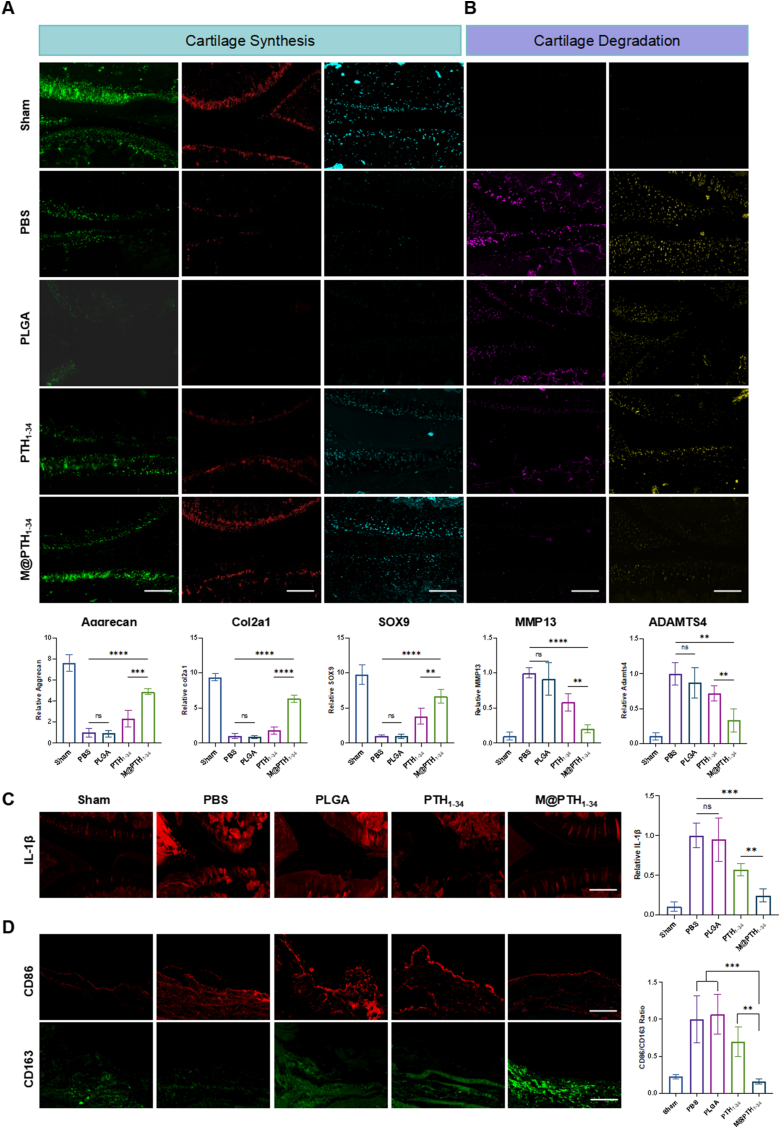
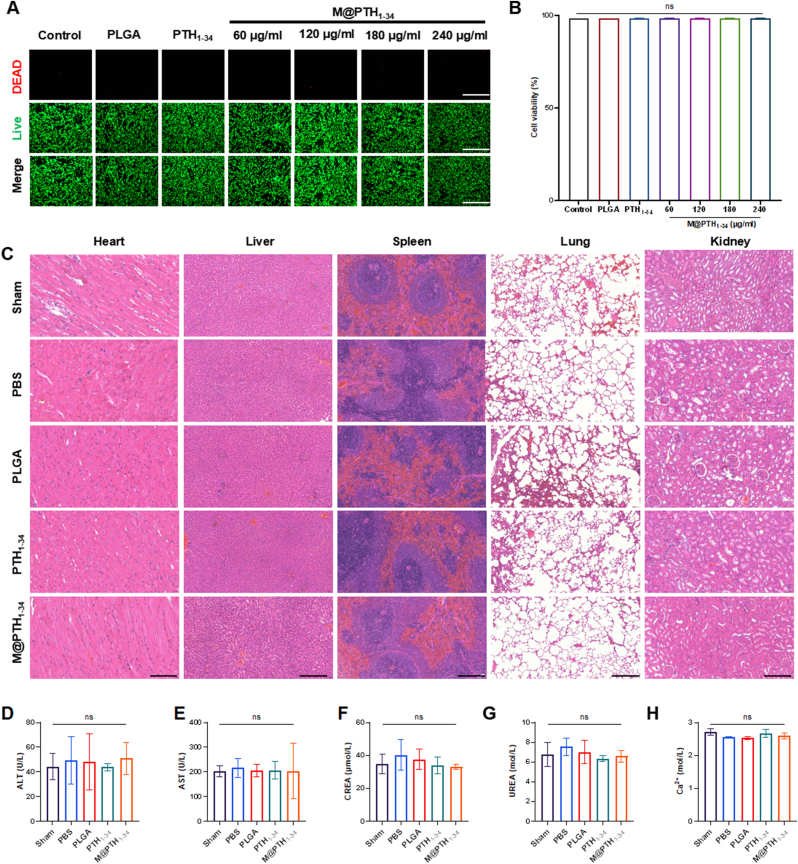
Results: PTH1-34 could be efficiently loaded into microspheres after self-healing and achieve consistent release over 30 days with biological activity being maintained. In OA model rats, M@PTH1-34 significantly improved behavioral and radiological outcomes, increased cartilage smoothness and thickness, and increased the expression of chondrogenic markers. Additionally, in vitro and in vivo safety tests revealed no significant safety issues. These findings indicate that M@PTH1-34 holds promise as a long-lasting, cost-effective, and safe therapeutic approach for OA.
Conclusion: This study successfully developed a uniform-sized PLGA-based sustained-release microsphere system (M@PTH1-34) that enables continuous drug release for over 30 days following single intra-articular administration. M@PTH1-34 exerts its therapeutic effects on osteoarthritis through the following two ways: (1) Promoting cartilage repair by enhancing the chondrogenic differentiation ability of bone marrow mesenchymal stem cells (BMSCs); (2) Improve the inflammatory microenvironment of joints by inhibiting the expression of inflammatory factors (such as IL-1β) and regulating the polarization state of M1/M2 macrophages.
The translation potential of this article: The system demonstrates prominent clinical translation advantages: (1) Innovative utilization of FDA-approved PLGA carrier combined with membrane emulsification technique ensures precise size control and standardized production; (2) Localized delivery strategy achieves targeted retention within articular cavity, validated by animal studies showing no systemic exposure risks; (3) Standardized preparation process demonstrates the feasibility of industrial-scale production.
Keywords: Cartilage repair; Osteoarthritis; PTH1-34; Porous PLGA microspheres; Sustained release.
© 2025 The Authors.
Conflict of interest statement
The authors declare that they have no known competing financial interests or personal relationships that could have appeared to influence the work reported in this paper.
Figures
Similar articles
-
Systemic pharmacological treatments for chronic plaque psoriasis: a network meta-analysis.Cochrane Database Syst Rev. 2021 Apr 19;4(4):CD011535. doi: 10.1002/14651858.CD011535.pub4. Cochrane Database Syst Rev. 2021. Update in: Cochrane Database Syst Rev. 2022 May 23;5:CD011535. doi: 10.1002/14651858.CD011535.pub5. PMID: 33871055 Free PMC article. Updated.
-
Systemic pharmacological treatments for chronic plaque psoriasis: a network meta-analysis.Cochrane Database Syst Rev. 2017 Dec 22;12(12):CD011535. doi: 10.1002/14651858.CD011535.pub2. Cochrane Database Syst Rev. 2017. Update in: Cochrane Database Syst Rev. 2020 Jan 9;1:CD011535. doi: 10.1002/14651858.CD011535.pub3. PMID: 29271481 Free PMC article. Updated.
-
Comparison of the effectiveness of inhaler devices in asthma and chronic obstructive airways disease: a systematic review of the literature.Health Technol Assess. 2001;5(26):1-149. doi: 10.3310/hta5260. Health Technol Assess. 2001. PMID: 11701099
-
Home treatment for mental health problems: a systematic review.Health Technol Assess. 2001;5(15):1-139. doi: 10.3310/hta5150. Health Technol Assess. 2001. PMID: 11532236
-
Non-steroidal anti-inflammatory drugs (NSAIDs) for chronic non-cancer pain in children and adolescents.Cochrane Database Syst Rev. 2017 Aug 2;8(8):CD012537. doi: 10.1002/14651858.CD012537.pub2. Cochrane Database Syst Rev. 2017. PMID: 28770976 Free PMC article.
References
-
- Martel-Pelletier J., Barr A.J., Cicuttini F.M., Conaghan P.G., Cooper C., Goldring M.B., et al. Osteoarthritis. Nat Rev Dis Primers. 2016;2 - PubMed
-
- Hunter D.J., March L., Chew M. Osteoarthritis in 2020 and beyond: a lancet commission. Lancet (London, England) 2020;396(10264):1711–1712. - PubMed
-
- Richard M.J., Driban J.B., McAlindon T.E. Pharmaceutical treatment of osteoarthritis. Osteoarthr Cartil. 2023;31(4):458–466. - PubMed
LinkOut - more resources
Full Text Sources
Research Materials
