. 2025 Jun 5:16:1575705.
doi: 10.3389/fneur.2025.1575705. eCollection 2025.

Global trends and regional disparities in the burden of headache disorders, 1990-2021: a comprehensive analysis of the global burden of disease study

Affiliations

Global trends and regional disparities in the burden of headache disorders, 1990-2021: a comprehensive analysis of the global burden of disease study

Yuanyuan Rui et al. Front Neurol. .

Abstract

Background: Headache disorders significantly impact health and functioning, yet studies on their global burden across all age groups are limited. This study utilizes data from the Global Burden of Disease (GBD) 2021 to investigate the global burden of headache disorders.

Methods: This analysis draws on GBD 2021 data, covering 204 countries and territories. We investigated the prevalence, incidence, and DALYs for headache disorders from 1990 to 2021, calculating Estimated Annual Percentage Change (EAPC) to analyze temporal trends. Additionally, decomposition analysis was used to evaluate the contributions of aging, population growth, and epidemiological changes. The slope index of inequality and concentration index were employed to assess inequalities in disease burden.

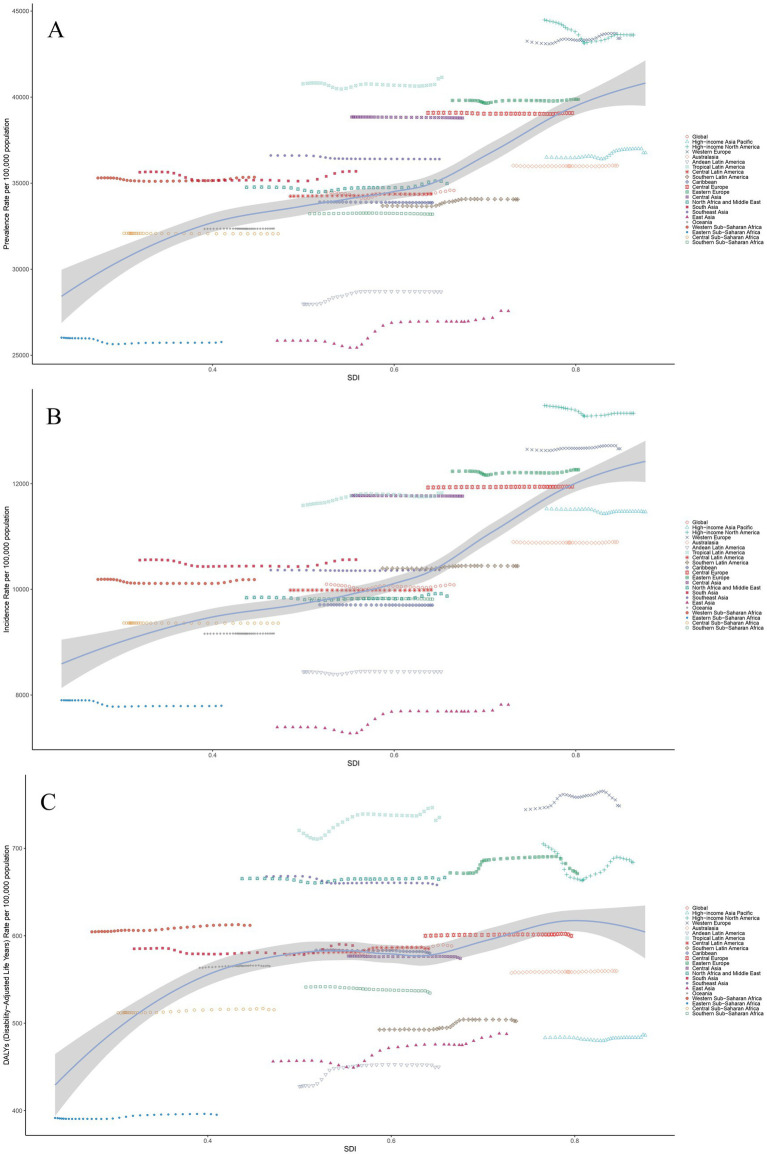
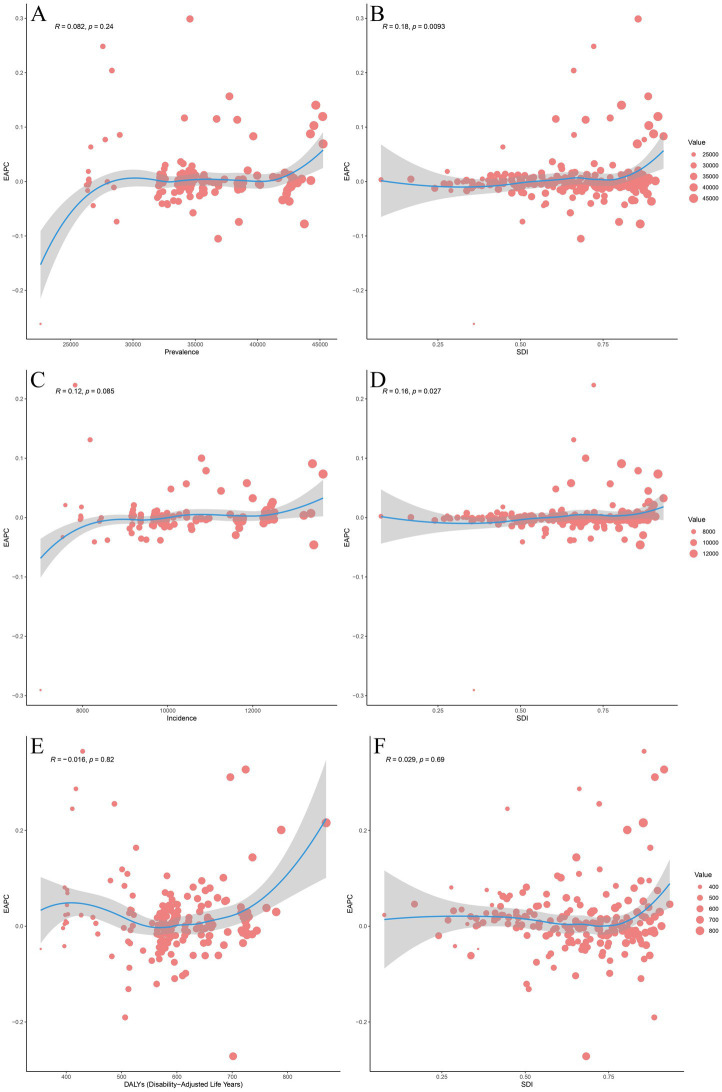
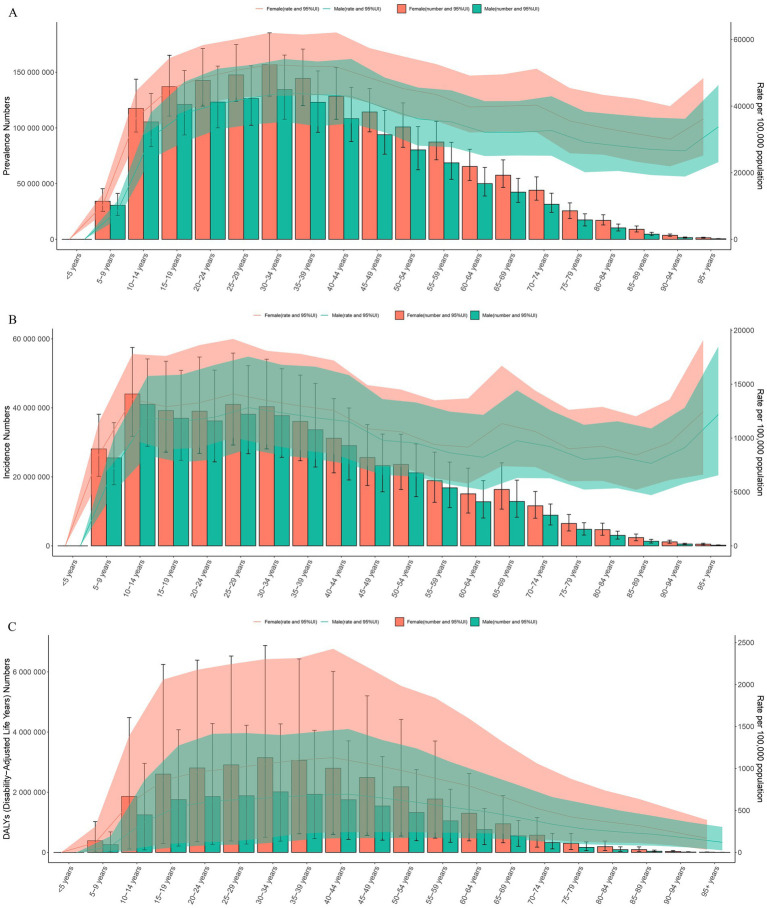
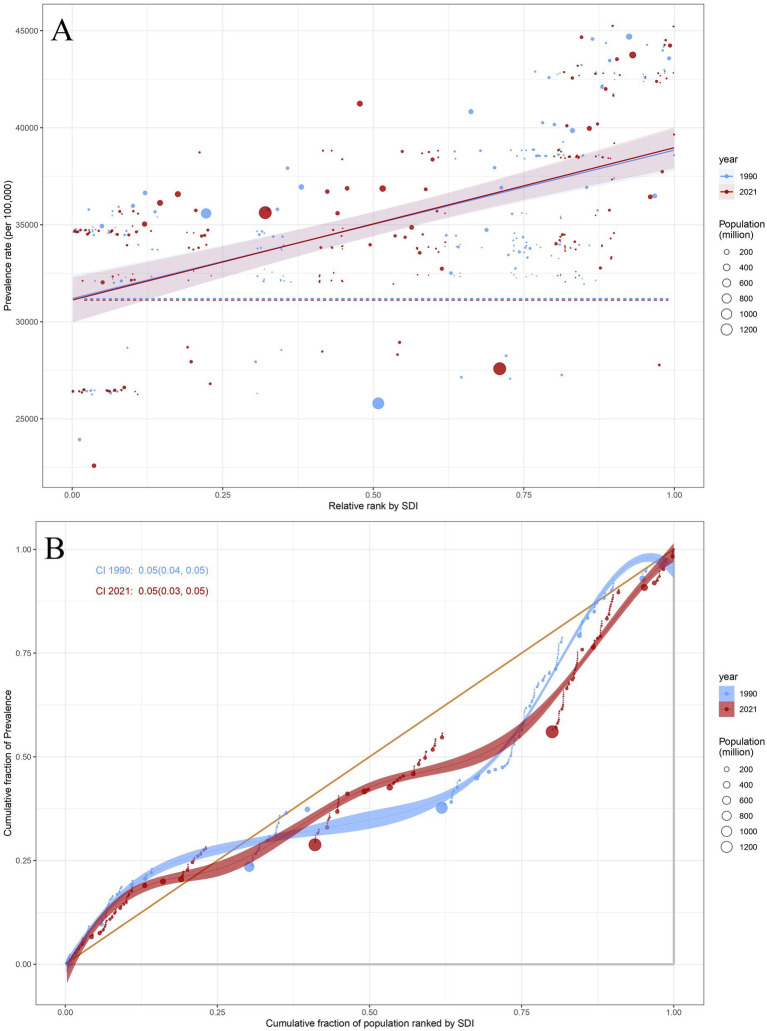
Results: From 1990 to 2021, the global prevalence of headache disorders increased significantly, reaching approximately 2.81 billion cases in 2021, a 57.16% increase from approximately 1.79 billion cases in 1990. During this period, the global Age-Standardized Prevalence Rate (ASPR) and Age-Standardized DALY Rate (ASDR) both showed gradual increases, while the Age-Standardized Incidence Rate (ASIR) remained stable, with EAPC values of 0.01, 0.04 and-0.0002, respectively. High Socio-demographic Index (SDI) regions exhibited the highest rates of ASPR, ASIR, and ASDR, whereas Middle SDI regions experienced the fastest growth, with EAPC values of 0.17, 0.17, and 0.18, respectively. The SDI exhibited significant positive correlations with the EAPC of ASPR (R = 0.18, p = 0.0093) and ASIR (R = 0.16, p = 0.027). Decomposition analysis identified population growth as the primary driver in regions with increasing disease burden. The slope index of inequality (SII) shows that disparities in ASPR, ASIR, and ASDR slightly increased from 7,648.13, 2,506.76, and 88.45 in 1990 to 7,851.55, 2,557.94, and 100.38 in 2021. In contrast, the concentration index (CI) in 2021 were 0.05, 0.05, and 0.04, showing no significant change from 1990.

Conclusion: Headache disorders continue to impose a growing burden globally, with marked regional and socio-economic disparities. Addressing these trends requires targeted public health interventions, particularly in high-burden and low-resource settings.

Keywords: decomposition analysis; estimated annual percentage change; global burden of disease; headache disorders; health inequality; socio-demographic index.


Conflict of interest statement

The authors declare that the research was conducted in the absence of any commercial or financial relationships that could be construed as a potential conflict of interest.

Figures

Figure 1
Figure 1
Trends of prevalence in headache disorder from 1990 to 2021. The global ASPR of headache disorders from 1990 to 2021, disaggregated by SDI regions and sex. (A) Represents data for both sexes combined, (B) for females, and (C) for males. High SDI regions consistently exhibit the highest ASPR across all years, while low SDI regions report the lowest rates. Trends highlight a gradual increase in ASPR for low- and middle-SDI regions, with minimal variation in high-SDI regions. The gap between male and female ASPR is evident across all SDI regions, with females consistently experiencing higher prevalence rates. SDI, Socio-demographic Index; ASPR, Age-Standardized Prevalence Rate.
Figure 2
Figure 2
The associations between the SDI and headache disorder across 21 GBD regions. (A) Association between ASPR and SDI. (B) Association between ASIR and SDI. (C) Association between ASDR and SDI. (A–C) The association between SDI and ASPR, ASIR, and ASDR, respectively, across 21 GBD regions in 2021. The lines represent the overall trends, with individual points corresponding to each region, colored by their respective regions. Shaded areas indicate 95% uncertainty intervals. Notable variability is observed among regions, reflecting distinct socio-demographic and healthcare factors influencing the burden of headache disorders. ASPR, Age-Standardized Prevalence Rate; ASIR, Age-Standardized Incidence Rate; ASDR, Age-Standardized Disability-Adjusted Life Years; SDI, Socio-demographic Index; DALYs, Disability-Adjusted Life Years.
Figure 3
Figure 3
(A) The ASPR of headache disorders in 204 countries and territories in 2021. (B) The case changes in the prevalence of headache disorders across 204 countries and territories from 1990 to 2021. (C) EAPC of ASPR. Global ASPR of headache disorders per 100,000 population in 2021. Darker shades indicate higher prevalence, with detailed regional focus in Caribbean and Central America, Persian Gulf, Balkan Peninsula, Southeast Asia, West Africa, Eastern Mediterranean, and Northern Europe. Percent change in prevalence rates of headache disorders from 1990 to 2021, showing areas with significant increases or decreases. EAPCs of ASPR of headache disorder from 1990 to 2021, highlighting regions with notable growth or decline. ASPR, age-standardized prevalence rate; EAPC, estimated annual percentage change.
Figure 4
Figure 4
The associations between EAPC and ASPR, ASIR, ASDR, and SDI. (A) The association between EAPC and ASPR in 2021. (B) The association between EAPC of ASPR and SDI. (C) The association between EAPC and ASIR in 2021. (D) The association between EAPC of ASIR and SDI in 2021. (E) The association between EAPC and ASDR in 2021. (F) The association between EAPC of ASDR and SDI. The association between EAPC of ASPR and ASPR for headache disorder across 204 countries and territories in 2021. The size of the circle increases with the number of prevalence. The R indices and p values were derived from Pearson correlation analysis. The association between EAPC of ASPR and SDI for headache disorder across 204 countries and territories in 2021. The blue line represents expected values based on SDI and disease across 204 countries and territories; each point shows the observed ASPR for the specified countries in 2021. The association between EAPC of ASIR and ASIR for headache disorder across 204 countries and territories in 2021. The size of the circle increases with the number of incidence. The R indices and p values were derived from Pearson correlation analysis. The association between EAPC of ASIR and SDI for headache disorder across 204 countries and territories in 2021. The blue line represents expected values based on SDI and disease across 204 countries and territories; each point shows the observed ASIR for the specified countries in 2021. The association between EAPC of ASDR and ASDR for headache disorder across 204 countries and territories in 2021. The size of the circle increases with the number of DALYs. The R indices and p values were derived from Pearson correlation analysis. The association between EAPC of ASDR and SDI for headache disorder across 204 countries and territories in 2021. The blue line represents expected values based on SDI and disease across 204 countries and territories; each point shows the observed ASDR for the specified countries in 2021. EAPC, Estimated Annual Percentage Change; ASPR, Age-Standardized Prevalence Rate; ASIR, Age-Standardized Incidence Rate; ASDR, Age-Standardized Disability-Adjusted Life Years; SDI, Socio-demographic Index; DALYs, Disability-Adjusted Life Years.
Figure 5
Figure 5
The bar charts represent the number of prevalence, incidence, and DALYs across different age groups, while the line charts show the prevalence, incidence, and DALY rates. (A) Prevalence. (B) Incidence. (C) DALYs. Prevalence by age group and gender, with male and female data presented as the number of cases and rates (per 100,000 population) in 2021. Error bars indicate the 95% uncertainty intervals. Female values are represented in red, and male values in green. Incidence by age group and gender in 2021, similar to (A), displaying data as counts and rates. (C) DALYs by age group and gender, illustrating the burden across all age groups. The size of each bar is proportional to the burden represented by DALYs, with red indicating female and green indicating male, along with 95% UI. DALYs, Disability-Adjusted Life Years; UI, Uncertainty Interval.
Figure 6
Figure 6
Decomposition analysis of headache disorder change in prevalence by SDI and 21 GBD regions, 1990 to 2021. Decomposition of the change in the prevalence of headache disorders from 1990 to 2021 by regions, showing contributions from aging, epidemiological change, and population growth. Red bars represent the contribution of aging, blue bars indicate epidemiological change, and green bars show population growth. The size of each bar corresponds to the respective regional contribution. The black dots represent the overall trend in disease burden change for each region. SDI, Sociodemographic Index; GBD, Global burden of disease.
Figure 7
Figure 7
(A) Health inequality regression curves of prevalence for headache disorders. (B) Concentration curves of prevalence for headache disorders. (A) The relationship between ASPR and relative rank by SDI for headache disorders across 204 countries in 1990 and 2021. Points represent countries with varying population sizes, denoted by the size of the circle (population in millions). The blue dotted line represents the trend for 1990, and the red solid line shows the trend for 2021, along with shaded confidence intervals. (B) The cumulative fraction of ASPR for headache disorders across 204 countries in 1990 and 2021. Points represent the cumulative fraction of prevalence across different SDI categories, while the line reflects the cumulative trends in prevalence rates. The CI values for 1990 and 2021 are shown as well. ASPR, Age-Standardized Prevalence Rate; SDI, Sociodemographic Index; CI, concentration index.

Similar articles

References

    1. GBD 2021 Nervous System Disorders Collaborators . Global, regional, and national burden of disorders affecting the nervous system, 1990-2021: a systematic analysis for the global burden of disease study 2021. Lancet Neurol. (2024) 23:344–81. doi: 10.1016/S1474-4422(24)00038-3, PMID: - DOI - PMC - PubMed
    1. GBD 2021 Diseases and Injuries Collaborators . Global incidence, prevalence, years lived with disability (YLDs), disability-adjusted life-years (DALYs), and healthy life expectancy (HALE) for 371 diseases and injuries in 204 countries and territories and 811 subnational locations, 1990-2021: a systematic analysis for the global burden of disease study 2021. Lancet. (2024) 403:2133–61. doi: 10.1016/S0140-6736(24)00757-8, PMID: - DOI - PMC - PubMed
    1. Charles A. The pathophysiology of migraine: implications for clinical management. Lancet Neurol. (2018) 17:174–82. doi: 10.1016/S1474-4422(17)30435-0, PMID: - DOI - PubMed
    1. Goadsby PJ, Holland PR, Martins-Oliveira M, Hoffmann J, Schankin C, Akerman S. Pathophysiology of migraine: a disorder of sensory processing. Physiol Rev. (2017) 97:553–622. doi: 10.1152/physrev.00034.2015, PMID: - DOI - PMC - PubMed
    1. Pellegrino ABW, Davis-Martin RE, Houle TT, Turner DP, Smitherman TA. Perceived triggers of primary headache disorders: a meta-analysis. Cephalalgia. (2018) 38:1188–98. doi: 10.1177/0333102417727535, PMID: - DOI - PMC - PubMed

LinkOut - more resources