. 2025 Jun 10:52:182-199.
doi: 10.1016/j.bioactmat.2025.06.008. eCollection 2025 Oct.

Near-infrared light-induced photothermal and immunotherapy system for lung cancer bone metastasis treatment with simultaneous bone repair

Affiliations

Near-infrared light-induced photothermal and immunotherapy system for lung cancer bone metastasis treatment with simultaneous bone repair

Guoqing Zhong et al. Bioact Mater. .

Abstract

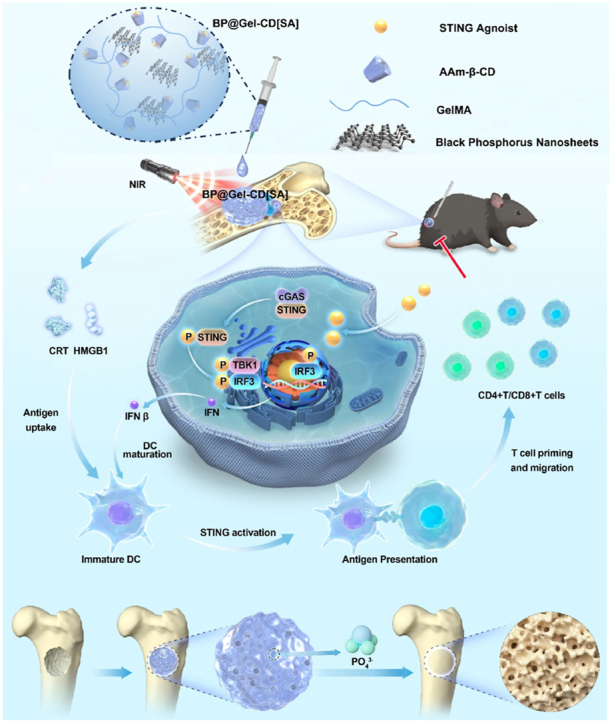
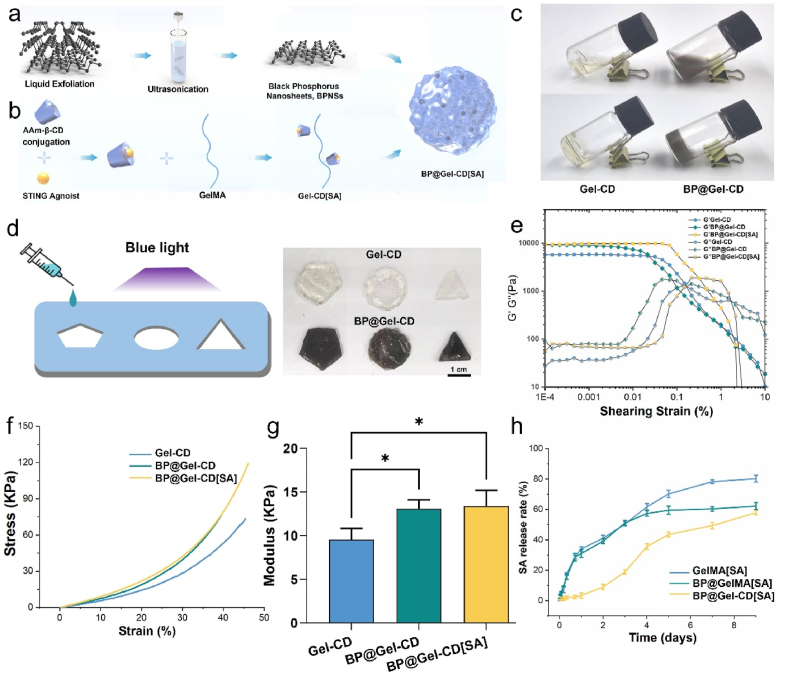
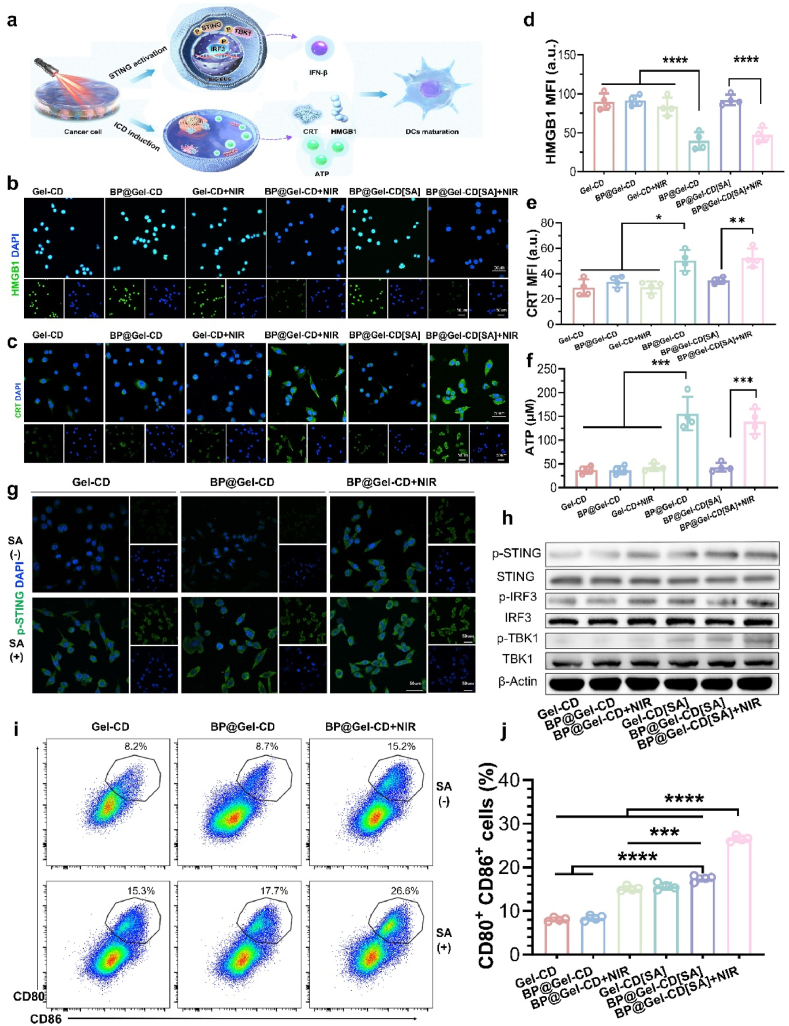
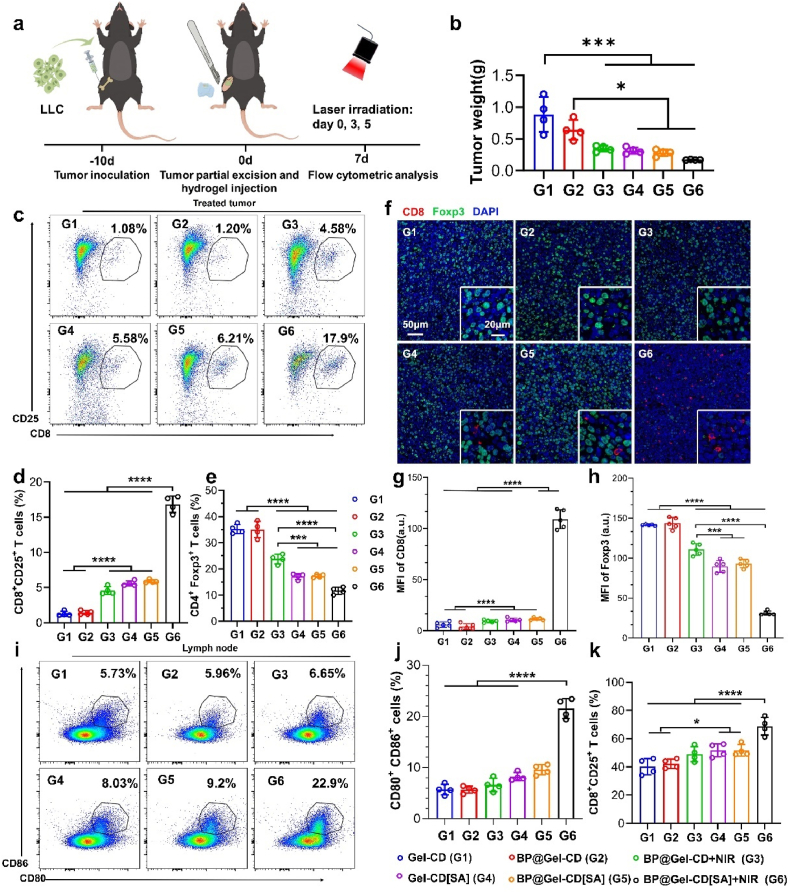
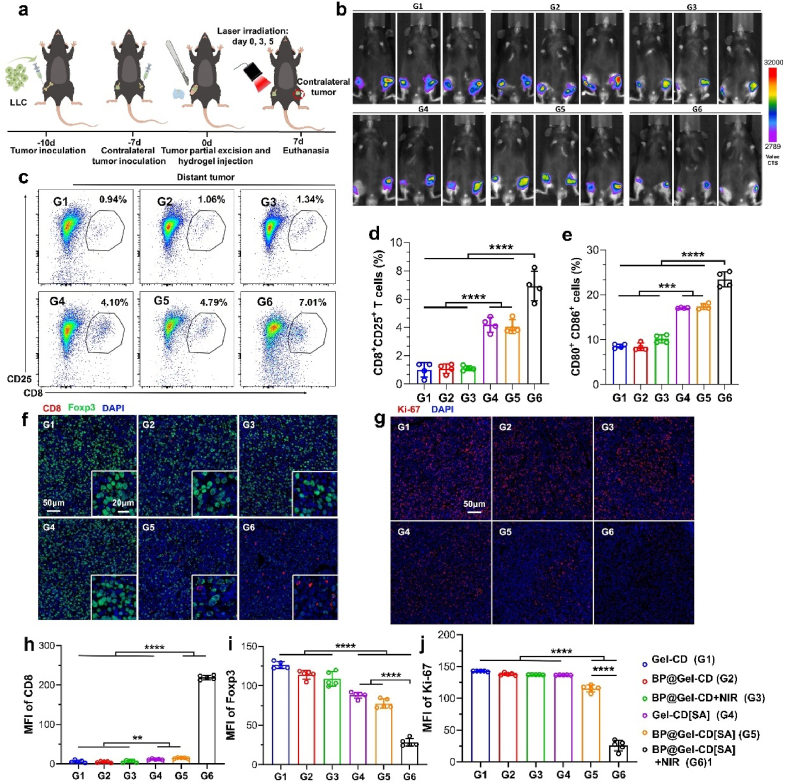
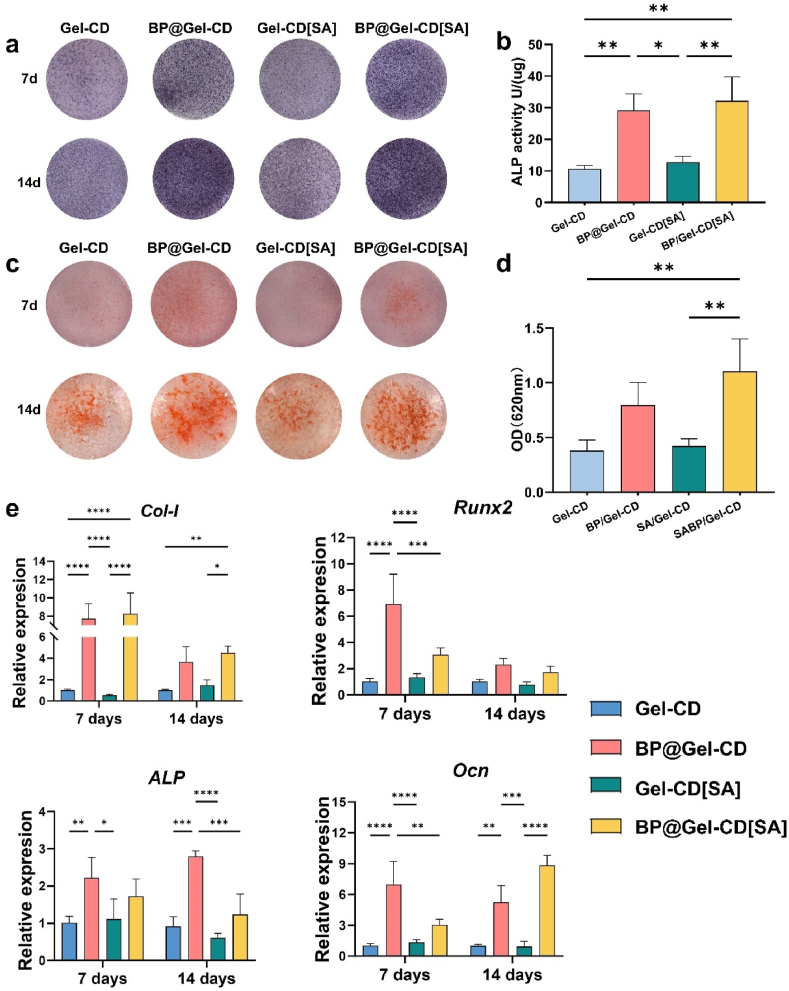
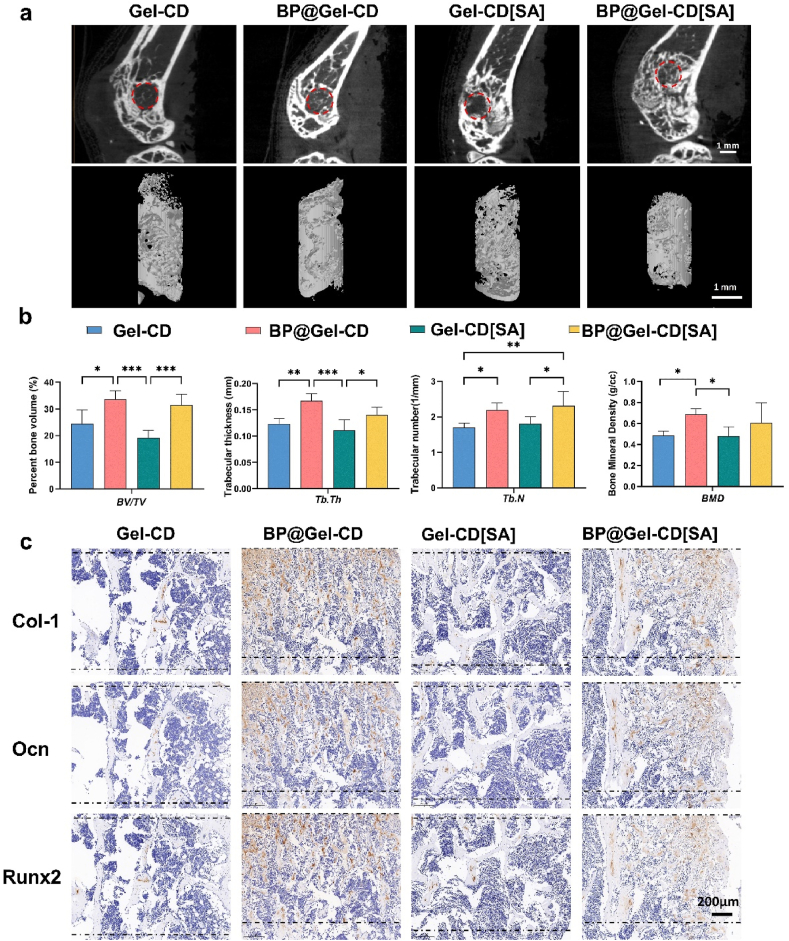
Approximately half of lung cancer patients experience bone metastasis, leading to bone loss, fracture, and other skeletal-related events. Although immunotherapies have significantly advanced the therapeutic landscape for lung cancer, bone metastases have an immunologically "cold" microenvironment, representing a challenging obstacle when treating lung cancer. The combination of immunotherapy and photothermal therapy (PTT) for treating tumor-induced bone defects holds promise for enhancing the efficacy of local tumor ablation and inhibiting tumor recurrence and metastasis through activating systemic immune responses. Herein, we developed an injectable hydrogel-based photothermal immunotherapy system (BP@Gel-CD[SA] hydrogel) incorporating STING agonists (SA) and black phosphorus nanosheets (BPNSs) for high-efficiency tumor elimination, immune activation, and bone regeneration. The photothermal and photodynamic activities of BPNSs induce hyperthermia and ROS-mediated apoptosis of tumor cells. Meanwhile, SA loaded into the nano-boxes in BP@Gel-CD[SA] hydrogel by host-guest interaction significantly activates the cGas-STING pathway. It stimulates immunogenic cell death (ICD), synergistically promoting immune cell infiltration. Single-cell RNA sequence analysis confirms the modulation of the tumor microenvironment (TME) through the PTT-mediated ICD effect and the transactivation of the cGAS-STING pathway in immune cells of the TME. More importantly, the system can significantly inhibit the growth of distant tumors via systemic immune activation and elicit long-term immune memory in addition to tumor eradication. In the long term, this hydrogel system can promote the formation of new bone at sites of tumor-induced bone destruction, improving bone strength in the affected area. Collectively, this strategy provides an effective and safe option for treating lung cancer bone metastases.

Keywords: Black phosphorus; Bone metastasis; Photothermal immunotherapy; STING activation.


Conflict of interest statement

The authors declare that they have no known competing financial interests or personal relationships that could have appeared to influence the work reported in this paper.

Figures

Image 1
Graphical abstract
Scheme 1
Scheme 1
A diagram illustrating the synthesis (a), and the anti-tumor (b), osteogenic (c) mechanism of BP@Gel-CD[SA] hydrogel treating lung cancer-derived bone metastatic lesions. The photothermal and photodynamic activities of BPNSs can achieve hyperthermia and reactive oxygen species (ROS)-mediated mitochondrial damage, while also enhancing antitumor immunity through immunogenic cell death (ICD). Local application of SA further induces tumor cells to release IFNβ, which would benefit the recruitment of immature DCs and activation of the adaptive immune system. In the long term, BPNSs can promote new bone formation at tumor-induced bone destruction sites, improving bone strength in the affected area.
Fig. 1
Fig. 1
Synthesis and Properties of BP@Gel-CD. synthesis of black phosphorus nanosheets (a) and Gel-CD (b). c) The Gel-CD and BP@Gel-CD hydrogel is cured in 10s under blue light. d) Various kinds of shapes of the BP@Gel-CD. e) The change of storage modulus (G′) and loss modulus (G″) of Gel-CD, BP@Gel-CD, and BP@Gel-CD[SA] hydrogels. f) Stress-strain curve of hydrogels. g) Elastic modulus of as-obtained Gel-CD, BP@Gel-CD, and BP@Gel-CD[SA] hydrogels. h) Quantified drug-releasing process of SA (n = 3). Data are presented as mean ± SD. ∗p < 0.05.
Fig. 2
Fig. 2
Photothermal transducing capability and cytotoxicity tests in vitro. a) Photothermal conversion tests before and after NIR irradiation in the centrifuge tubes. b) Temperature change curves of hydrogels. c) Cell live/dead staining of each group, scale bars = 50 μm. d) Representative flow cytometry dot plots of Annexin–FITC and PI-stained tumor cells showing apoptosis and necrosis rates after treatments. e) DCFH-DA-based detection of ROS production in LLC cells after the indicated treatments, scale bars = 50 μm. f) The quantification of apoptosis and necrosis rates in the flow cytometry analysis (n = 3). g) Quantification of ROS fluorescence intensity in Fig. 3e (n = 3). Data are presented as mean ± SD. Statistical analysis was performed using one-way ANOVA with Tukey's post-hoc test. ∗∗p < 0.01, ∗∗∗p < 0.001, ∗∗∗∗p < 0.0001.
Fig. 3
Fig. 3
ICD induction and STING activation of BP@Gel-CD[SA] in vitro. a) Schematic diagram showing the biological mechanism of DC maturation. b) The immunofluorescence captures of HMGB1 in vitro, scale bars = 50 μm. c) The immunofluorescence captures of CRT in vitro, scale bars = 50 μm. Quantification of fluorescence intensity of HMGB1 (d) and CRT (e). f) ATP production assays. g) The immunofluorescence captures of p-STING in LLC cells upon treatment of Gel-CD, BP@Gel-CD, BP@Gel-CD + NIR, Gel-CD[SA], BP@Gel-CD[SA] and BP@Gel-CD[SA] + NIR, scale bars = 50 μm. h) Western blotting showing the levels of STING pathways-related protein in LLC cells upon various treatments. i) Flow cytometric profiles and j) quantitative analysis of activated DC cells after incubation with LLC cells upon various treatments. Data are presented as mean ± SD. Statistical analysis was performed using one-way ANOVA with Tukey's post-hoc test. ∗∗p < 0.01, ∗∗∗p < 0.001, ∗∗∗∗p < 0.0001.
Fig. 4
Fig. 4
The therapeutic effects of hydrogels on tumor recurrence in complete intralesional curettage model of tumor-bearing mice. a) Timeline schematic for establishing the tumor mouse model and intervention. b) In vivo photothermal conversion ability of the gel under NIR laser at 1 W/cm2 and 808 nm. c) Representative in vivo imaging system (IVIS) spectrum images in mice from the different treatment groups (n = 5). d) Kaplan-Meier survival analysis in mice from the different treatment groups. The survival curves were statistically tested using the Log-rank test. e) Tumor volume growth curves in vivo (n = 5). Statistical differences in tumor volume between the two groups were analyzed using two-way ANOVA followed by Tukey's post hoc test. f) Representative flow cytometry analysis of the proportion of CD8+ T cells in the mouse spleen from the different treatment groups. g) Quantitative counts of CD8+ T cells in the mouse spleen from the different treatment groups. h) Quantitative percentage of CD80+CD86+ DC cells in the mouse spleen from the different treatment groups. i) Representative flow cytometry analysis of the proportion of CD80+ and CD86+ in the mouse spleen from the different treatment groups.). Data are presented as mean ± SD (n = 4). Statistical analysis was performed using one-way ANOVA with Tukey's post-hoc test.∗P < 0.05, ∗∗P < 0.01, ∗∗∗P < 0.001, and ∗∗∗∗P < 0.0001.
Fig. 5
Fig. 5
The evaluation of hydrogels on amelioration of the immunosuppressive TME and inhibition of tumor progression. a) Timeline schematic for establishing the tumor mouse model and intervention. b) Tumor volume at the time of tissue harvesting after one week. c) Representative flow cytometry analysis of the proportion of CD8+ T cells in the mouse tumor tissues from the different treatment groups. d) Quantitative percentage of CD8+CD25+ T cells. e) Quantitative percentage of CD4+Foxp3+ T cells. f) Representative images of multiple immunofluorescences staining for CD8 and Foxp3 in tumor tissues after one week of treatment. g-h) Average fluorescence intensity from the multiple immunofluorescence experiments for CD8 and Foxp3 in Figure f. i) Representative flow cytometry plots showing the proportion of CD80+ and CD86+ dendritic cells in draining lymph nodes after different treatments. j) Quantitative percentage of CD80+CD86+ dendritic cells relative to CD11c+ dendritic cells from Figure i. k) Quantitative percentage of CD8+CD25+ T cells in draining lymph nodes after different treatments. Data are presented as mean ± SD (n = 4–5). Statistical analysis was performed using one-way ANOVA with Tukey's post-hoc test. ∗P < 0.05, ∗∗P < 0.01, ∗∗∗P < 0.001.
Fig. 6
Fig. 6
Tumor microenvironment changes after BP@Gel-CD[SA] + NIR treatment based on Single-cell RNA sequence. a) Schematic diagram of Single-cell RNA sequence. b) Violin plot of marker genes for cell type identification. c) UMAP plot of cell types. d) The tSNE plot of immune cell subpopulations (undefined cells not shown). e) The proportion of cell types in tumor tissue after BP@Gel-CD[SA] + NIR treatment. f)Ridge plot of marker genes for immune cell identification. g) GSEA analysis of enriched pathways in immune cells. h) tSNE plots showing the expression scores of M1-and M2-like macrophage signatures in macrophages. i)Scores of M1 and M2-like macrophage gene sets after BP@Gel-CD[SA] + NIR treatment.
Fig. 7
Fig. 7
Therapeutic Effects of BP@Gel-CD[SA] + NIR on Distant Tumors via immune activation. a) Timeline schematic for establishing the tumor mouse model and intervention. b) In vivo imaging of mice at one week. c) Representative flow cytometry plots depicting the proportion of CD8+ CD25+ T cells in abscopal tumor tissues after different treatments. d) Quantitative percentage of CD8+CD25+ T cells. e) Quantitative percentage of CD80+ and CD86+ in tumor-draining lymph nodes after different treatments. f) Representative images of multiple immunofluorescences staining for CD8 and Foxp3 in abscopal tumor tissues one week after treatment. g) Representative images of Ki67 immunofluorescence staining in abscopal tumor tissues after one week of treatment. h-j) Quantification of fluorescence intensity for CD8, Foxp3, and Ki67 in abscopal tumor tissues. Data are presented as mean ± SD(n = 4–5). Statistical analysis was performed using one-way ANOVA with Tukey's post-hoc test (GraphPad Prism 9). p < 0.01. ∗P < 0.05, ∗∗P < 0.01, ∗∗∗P < 0.001, and ∗∗∗∗P < 0.0001.
Fig. 8
Fig. 8
In vitro osteogenic properties of hydrogel. a) Alkaline Phosphatase (ALP) staining of C3H10 cells cultured in conditional medium containing extracts from Gel-CD, BP@Gel-CD, Gel-CD[SA], and BP@Gel-CD[SA] for 7 and 14 days. b) Semi-quantitative analysis of ALP staining. c) Alizarin Red staining. d) OD value detection at 565 nm of the degradation solution from Alizarin Red staining. e) Expression of osteogenic genes including Runx2, ALP, Col-1, and OCN. Data are presented as mean ± SD (n = 3). Statistical analysis was performed using one-way ANOVA with Tukey's post-hoc test. ∗P < 0.05, ∗∗P < 0.01, ∗∗∗P < 0.001, and ∗∗∗∗P < 0.0001.
Fig. 9
Fig. 9
In vivo osteogenic ability of hydrogel. a) Micro-CT images of newly formed bone at 6 weeks post-implantation in the mouse femoral condyle. scale bars = 0.75 mm. b) Quantitative analysis of BV/TV, Tb.Th, Tb.N, and BMD. c) Representative immunohistochemical staining images of newly formed bone, two parallel dashed lines indicating the bone defect region. Data are presented as mean ± SD (n = 5). Statistical analysis was performed using one-way ANOVA with Tukey's post-hoc test. ∗P < 0.05, ∗∗P < 0.01, ∗∗∗P < 0.001.
Fig. 10
Fig. 10
Efficacy of the multi-faceted treatment. a) Micro-CT assessment of bone defects, the top image shows a three-dimensional reconstruction, while the bottom image displays the corresponding axial section views. b) Reconstruction of the trabecular bone in the area of the bone defect. Quantitative analysis of BV/TV (c) and Tb.N.(d) of the trabecular bone in the area of the bone defect in Fig. 10b. Data are presented as mean ± SD (n = 5). Statistical analysis was performed using one-way ANOVA with Tukey's post-hoc test. e) HE staining images of the defect area, ∗ indicates remaining bone tissue in the tumor site, the dotted circle denotes the bone defect created during operation, and ▲ indicates the trabecular bone of newly formed bone.

Similar articles

References

    1. Leiter A., Veluswamy R.R., Wisnivesky J.P. The global burden of lung cancer: current status and future trends. Nat. Rev. Clin. Oncol. 2023;20:624–639. doi: 10.1038/s41571-023-00798-3. - DOI - PubMed
    1. Hofbauer L.C., Bozec A., Rauner M., Jakob F., Perner S., Pantel K. Novel approaches to target the microenvironment of bone metastasis. Nat. Rev. Clin. Oncol. 2021;18:488–505. doi: 10.1038/s41571-021-00499-9. - DOI - PubMed
    1. Abbott A.G., Meyers D.E., Elmi-Assadzadeh G., Stukalin I., Marro A., Puloski S.K.T., Morris D.G., Cheung W.Y., Monument M.J. Effectiveness of immune checkpoint inhibitor therapy on bone metastases in non-small-cell lung cancer. Front. Immunol. 2024;15 doi: 10.3389/fimmu.2024.1379056. - DOI - PMC - PubMed
    1. Zhu Y.-J., Chang X.-S., Zhou R., Chen Y.-D., Ma H.-C., Xiao Z.-Z., Qu X., Liu Y.-H., Liu L.-R., Li Y., Yu Y.-Y., Zhang H.-B. Bone metastasis attenuates efficacy of immune checkpoint inhibitors and displays “cold” immune characteristics in Non-small cell lung cancer, Lung Cancer Amst. Neth. 2022;166:189–196. doi: 10.1016/j.lungcan.2022.03.006. - DOI - PubMed
    1. Wan Y., Fu L.-H., Li C., Lin J., Huang P. Conquering the hypoxia limitation for photodynamic therapy. Adv. Mater. Deerfield Beach Fla. 2021;33 doi: 10.1002/adma.202103978. - DOI - PubMed

LinkOut - more resources