

Sex-specific associations between blood urea nitrogen and risk of hyperuricemia in U.S. adults: the NHANES 1999-2020
- PMID: 40538797
- PMCID: PMC12176573
- DOI: 10.3389/fendo.2025.1560738
Sex-specific associations between blood urea nitrogen and risk of hyperuricemia in U.S. adults: the NHANES 1999-2020
Abstract
Background: Blood urea nitrogen (BUN), one of the recognized indicators of renal function, is a key marker of metabolic diseases, but there are few data on the association of BUN levels with hyperuricemia (HUA) in the general adult population. The aim of the study is to explore the relationship between BUN and HUA in the general population and the potential impact of gender on this relationship.
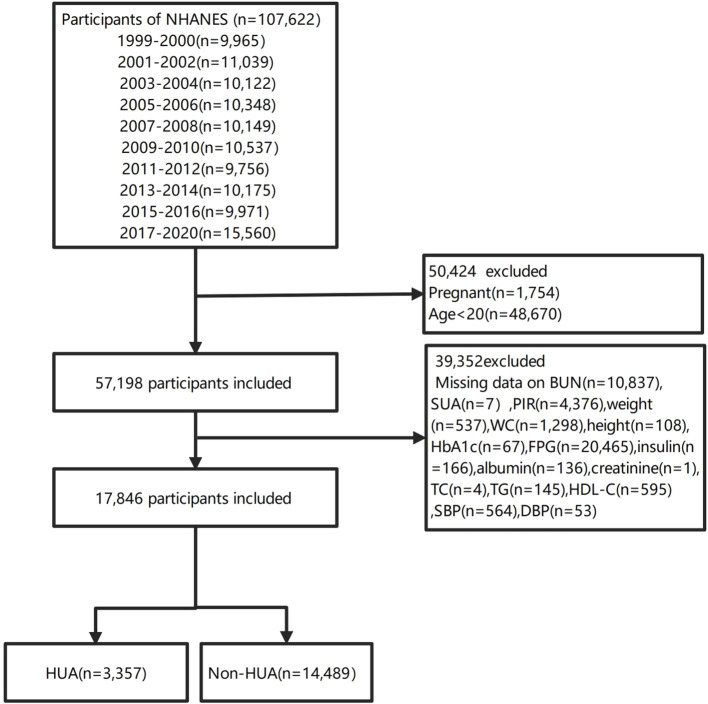
Methods: This study was conducted involving 17,846 adults from the National Health and Nutrition Examination Survey (NHANES) between 1999-2020. Data on age, gender, race, marital status, education level, height, weight, body mass index (BMI), waist circumference (WC), systolic blood pressure (SBP), diastolic blood pressure (DBP), triglyceride (TG), total cholesterol (TC), high-density lipoprotein cholesterol (HDL-C), low-density lipoprotein cholesterol (LDL-C), fasting plasma glucose (FPG), hemoglobin A1c (HbA1C), serum uric acid (SUA), BUN, creatinine, and albumin were collected from all participants. Multivariate logistic regression, curve fitting and subgroup analyses were employed to investigate the associations between BUN and HUA stratified by sex.
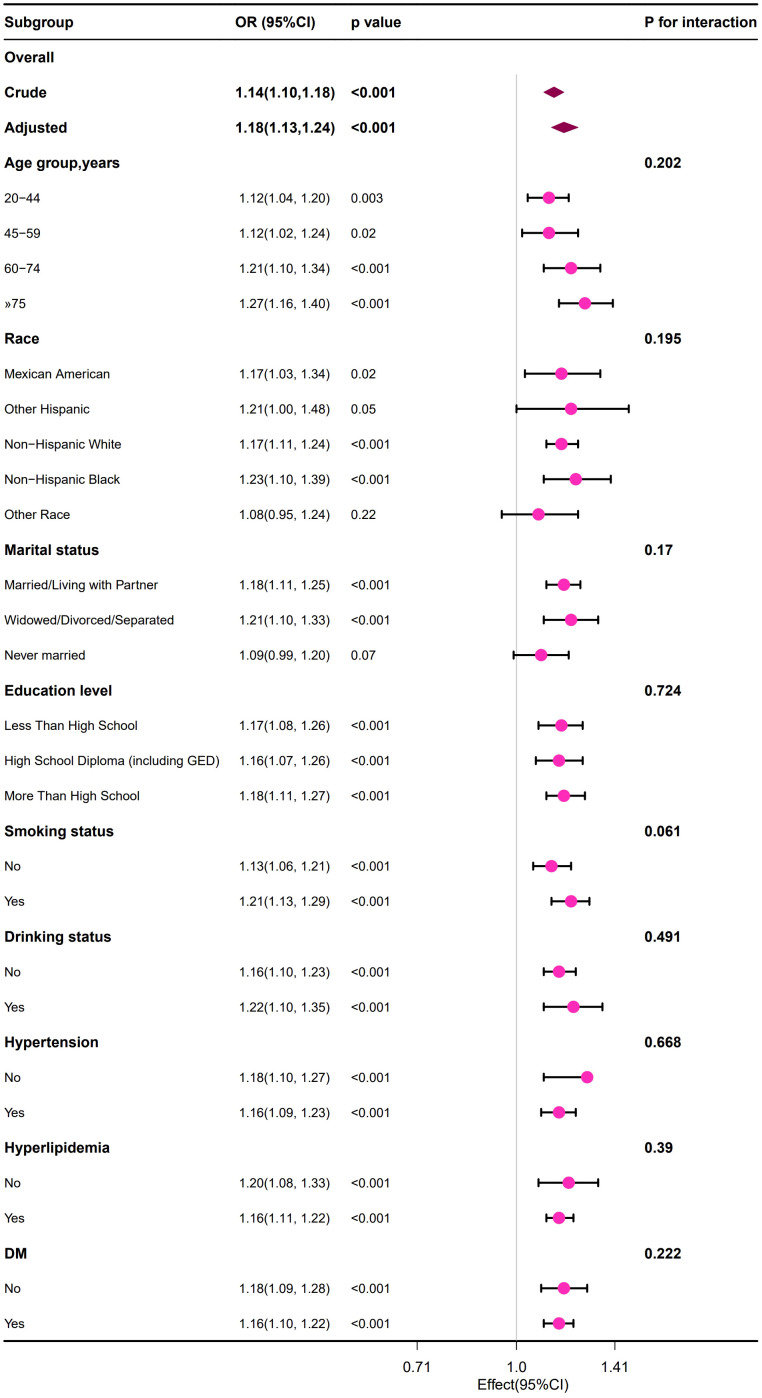
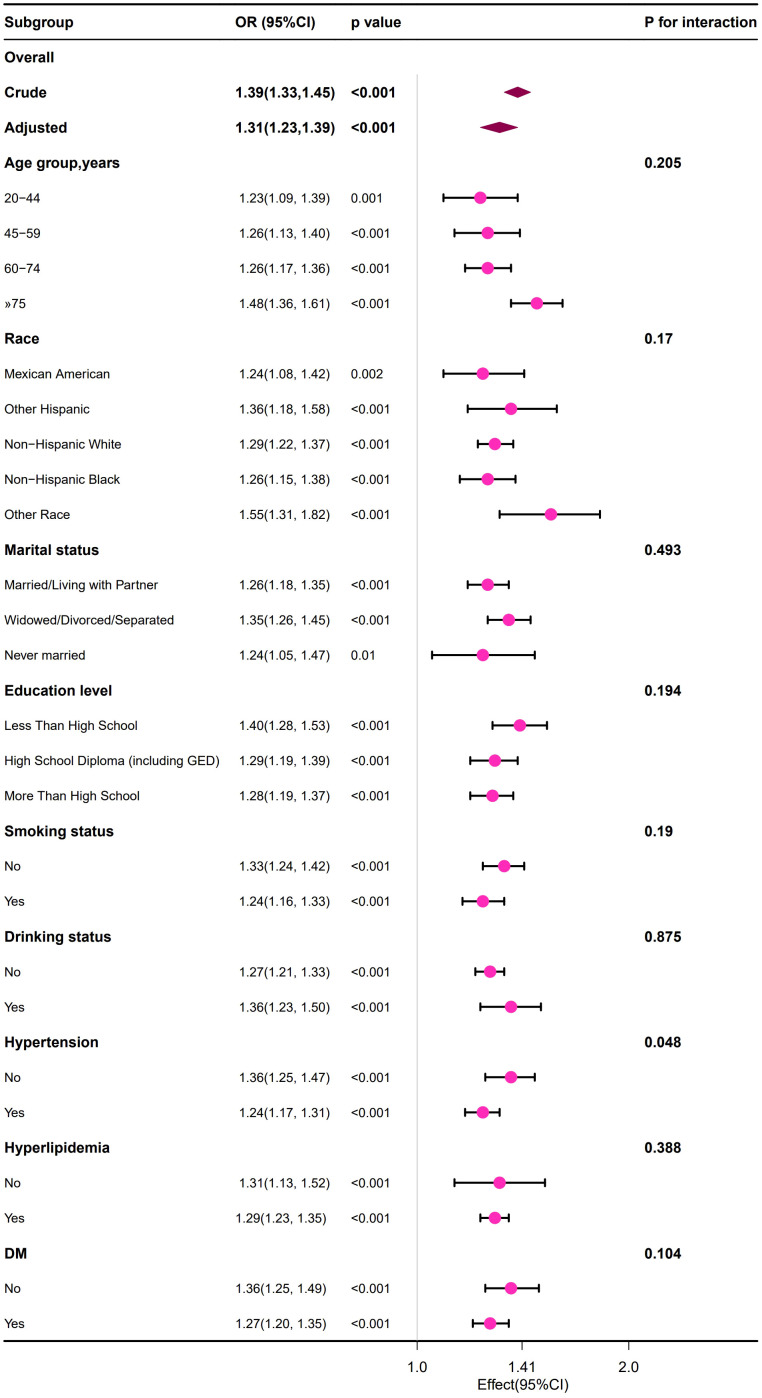
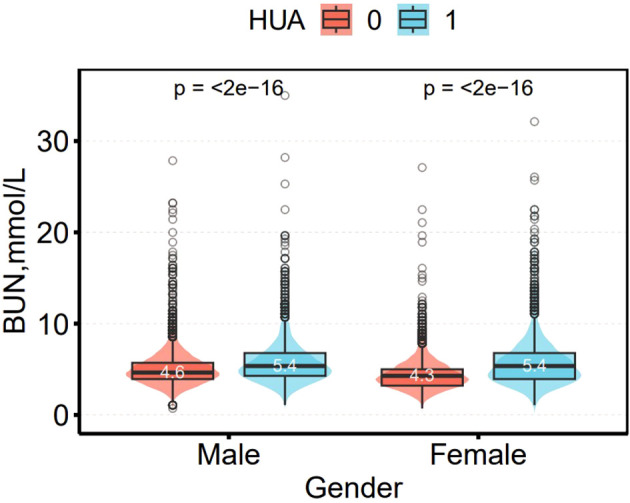
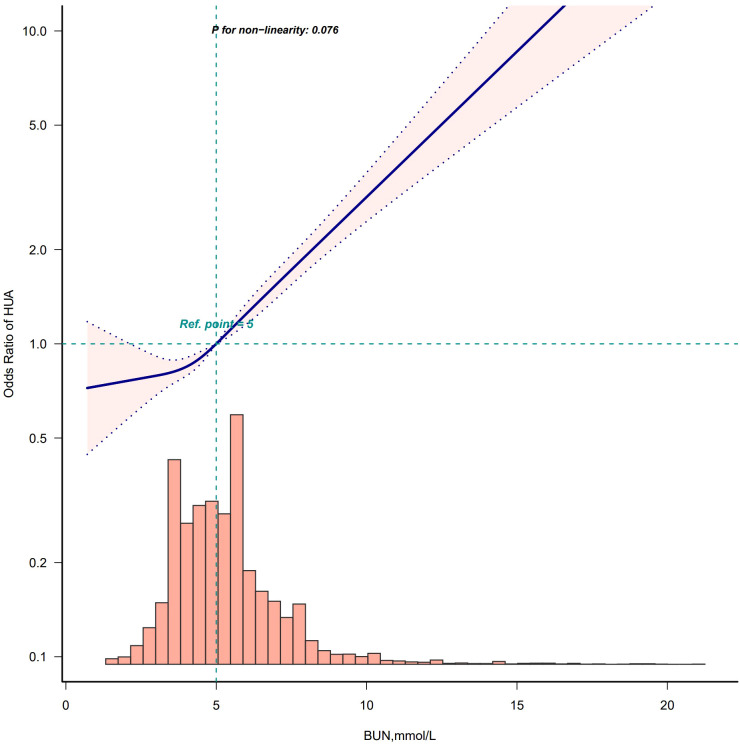
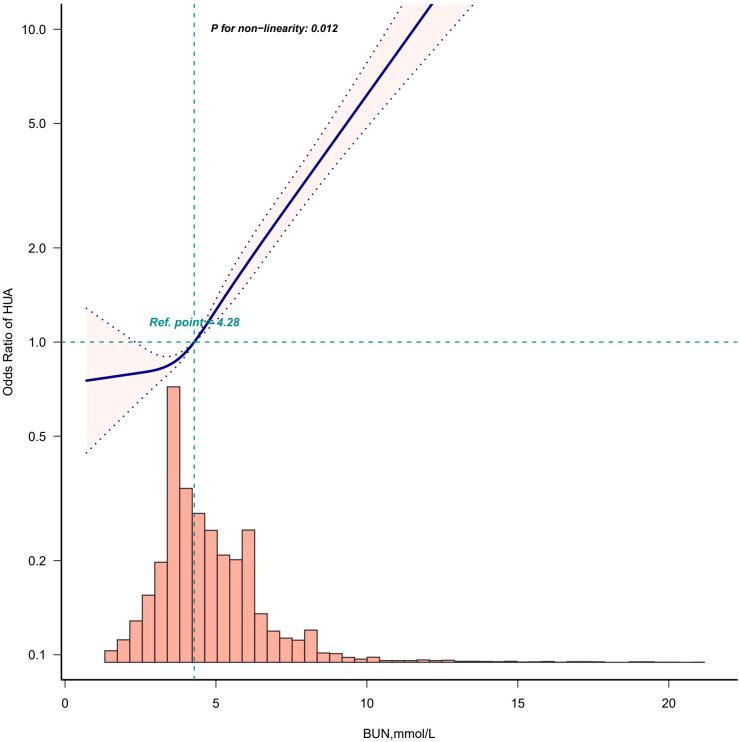
Results: After weighted analysis, the results of this study represented approximately 164.42 million U.S. adults. The overall prevalence of HUA was 18.22%, and 20.72% in males and 15.82% in females. In the fully adjusted model, there was a positive association between BUN and HUA and this positive association remained significantly stratified by sex. Smoothed curve-fitting analysis revealed that the dose-response relationship between BUN and the risk of developing HUA was linear in men and nonlinear in women. There was evidence of an interaction between BUN levels and gender status that increased the risk of HUA and the OR for the association between BUN and HUA was higher in females than in males. Subgroup analyses showed that the association between BUN and the risk of developing HUA remained consistently positive across all subgroups in both male and female participants.
Conclusions: This study confirmed that BUN were positively associated with HUA among U.S. adults that remained significant when stratified by sex, but there were gender differences in the form and extent of this positive correlation.
Keywords: NHANES; blood urea nitrogen; gender medicine; hyperuricemia; risk.
Copyright © 2025 Chen and Yin.
Conflict of interest statement
The authors declare that the research was conducted in the absence of any commercial or financial relationships that could be construed as a potential conflict of interest.
Figures
Similar articles
-
Association between rheumatoid arthritis and hyperuricemia among adults: a cross-sectional study based on NHANES data.Clin Rheumatol. 2025 Apr;44(4):1759-1767. doi: 10.1007/s10067-025-07386-z. Epub 2025 Mar 6. Clin Rheumatol. 2025. PMID: 40047989 Free PMC article.
-
Association between visceral adiposity index and hyperuricemia and gout among US adults: a cross-sectional analysis of NHANES 2007-2018.Sci Rep. 2025 Jul 1;15(1):22196. doi: 10.1038/s41598-025-08138-4. Sci Rep. 2025. PMID: 40595266 Free PMC article.
-
Higher C-reactive protein to high-density lipoprotein cholesterol ratio is associated with hyperuricemia in diabetes and prediabetes: a cross-sectional study.Front Endocrinol (Lausanne). 2025 Jun 27;16:1619370. doi: 10.3389/fendo.2025.1619370. eCollection 2025. Front Endocrinol (Lausanne). 2025. PMID: 40655403 Free PMC article.
-
Effectiveness and safety of vitamin D in relation to bone health.Evid Rep Technol Assess (Full Rep). 2007 Aug;(158):1-235. Evid Rep Technol Assess (Full Rep). 2007. PMID: 18088161 Free PMC article.
-
Systemic pharmacological treatments for chronic plaque psoriasis: a network meta-analysis.Cochrane Database Syst Rev. 2017 Dec 22;12(12):CD011535. doi: 10.1002/14651858.CD011535.pub2. Cochrane Database Syst Rev. 2017. Update in: Cochrane Database Syst Rev. 2020 Jan 9;1:CD011535. doi: 10.1002/14651858.CD011535.pub3. PMID: 29271481 Free PMC article. Updated.
Cited by
-
Prevalence and risk factors of metabolic associated fatty liver disease in lean patients with bipolar disorder: a retrospective cross-sectional study.Front Endocrinol (Lausanne). 2025 Jul 30;16:1605484. doi: 10.3389/fendo.2025.1605484. eCollection 2025. Front Endocrinol (Lausanne). 2025. PMID: 40810071 Free PMC article.
References
MeSH terms
Substances
LinkOut - more resources
Full Text Sources
Miscellaneous