

Combination of ultrasound-based radiomics and deep learning with clinical data to predict response in breast cancer patients treated with neoadjuvant chemotherapy
- PMID: 40538839
- PMCID: PMC12176835
- DOI: 10.3389/fonc.2025.1525285
Combination of ultrasound-based radiomics and deep learning with clinical data to predict response in breast cancer patients treated with neoadjuvant chemotherapy
Abstract
Objectives: Accurate assessment of NAC efficacy is crucial for determining appropriate surgical strategies and guiding the extent of surgical resection in breast cancer. Therefore, this study aimed to design an integrated predictive model combining ultrasound imaging, deep learning features, and clinical characteristics to predict pCR in breast cancer patients undergoing NAC.
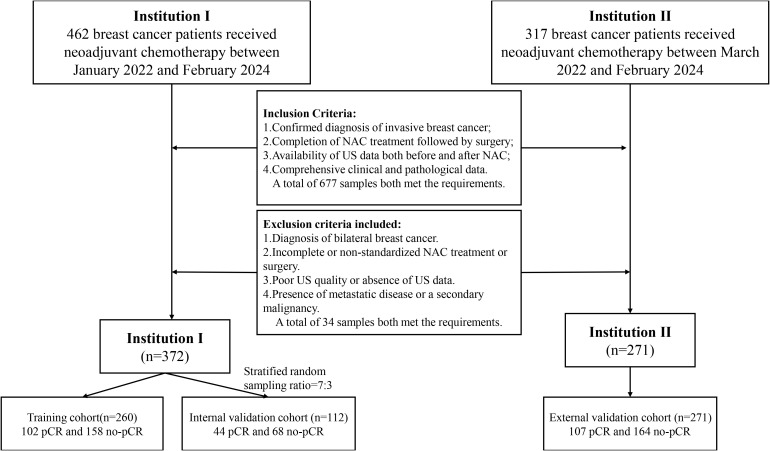
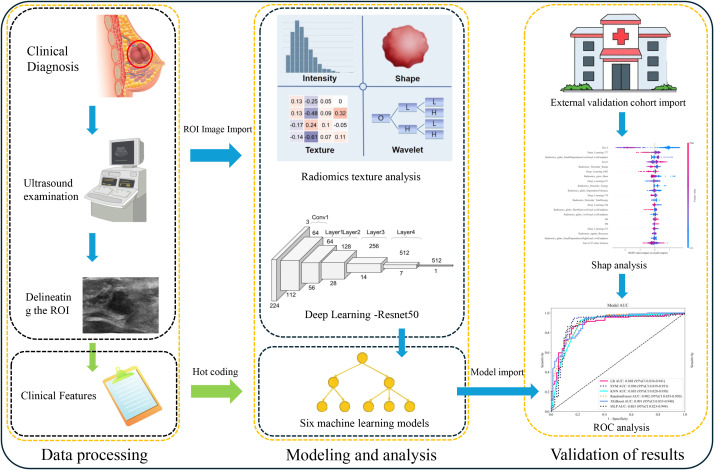
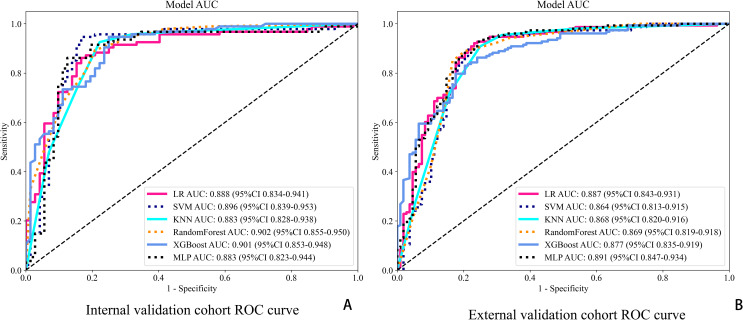
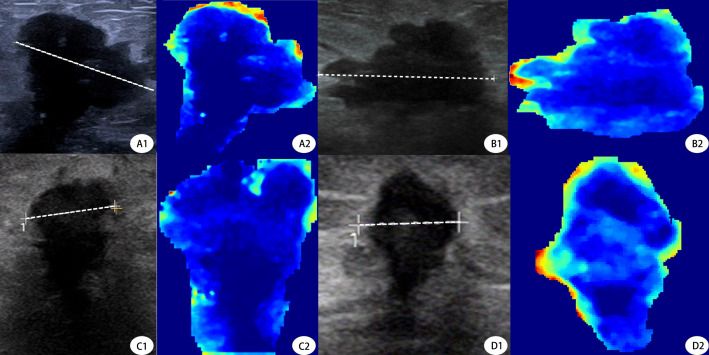
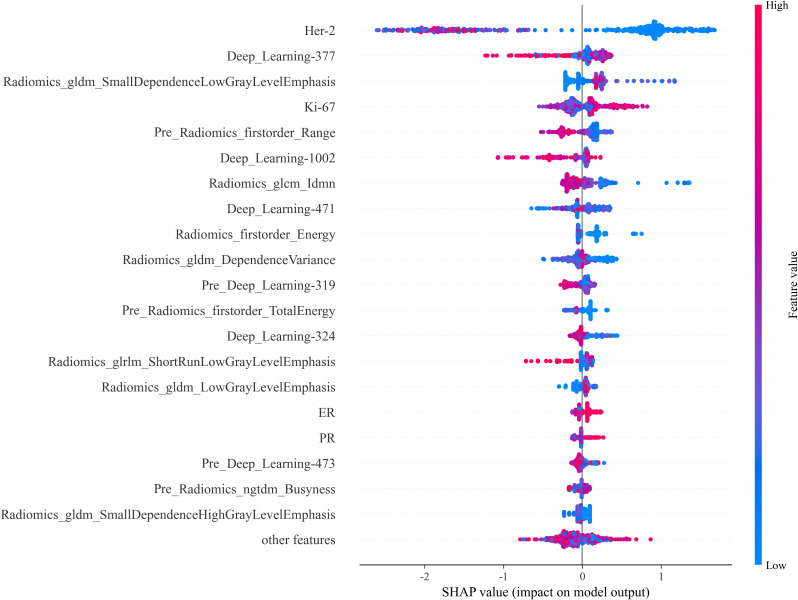
Methods: A retrospective study was conducted, including 643 pathologically confirmed breast cancer patients who underwent NAC between January 2022 to February 2024 from two institutions (Center 1: 372 cases; Center 2: 271 cases). Ultrasound images before and after NAC were collected for each patient. A total of 2,920 radiomics features and 4,096 deep learning features were extracted from the ultrasound images. Multiple machine learning algorithms were employed to model and validate the diagnostic performance of different types of features. Finally, clinical data, radiomics, and deep learning features were integrated to form a fusion model, which was evaluated using receiver operating characteristic (ROC) analysis.
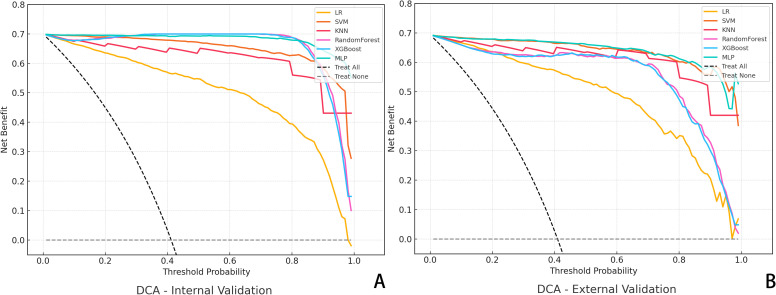
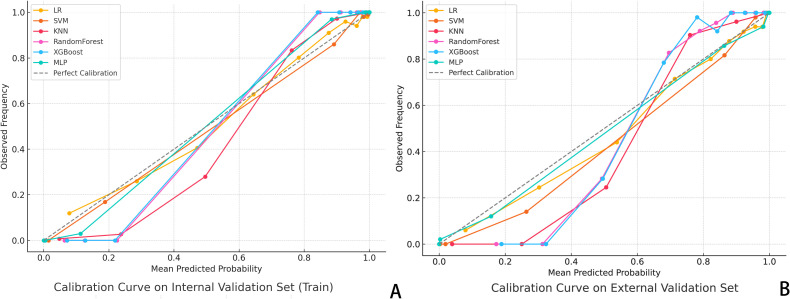
Results: The combined model achieved the highest predictive performance for pathological complete response (pCR) across both cohorts. In the internal validation cohort, it reached an accuracy of 0.892 (95% CI: 0.862-0.912) and an AUC of 0.901 (95% CI: 0.854-0.948). In the external cohort, it maintained strong performance with an accuracy of 0.857 (95% CI: 0.822-0.928) and an AUC of 0.891 (95% CI: 0.848-0.934), significantly outperforming the individual models (DeLong test, p < 0.01).The deep learning model showed solid performance with accuracies of 0.875 and 0.833 in the internal and external cohorts, respectively, and AUCs of 0.870 and 0.874. The radiomics model displayed moderate accuracy and AUC in both cohorts, while the clinical model showed the lowest predictive capability among the models, with accuracy and AUC values around 0.67 in both cohorts.
Conclusions: The combined model, integrating clinical, radiomics, and deep learning features, demonstrated superior predictive accuracy for pCR following neoadjuvant chemotherapy (NAC) in breast cancer patients, outperforming individual models. This integrated approach highlights the value of combining diverse data types to improve prediction, offering a promising tool for guiding NAC response assessment and personalized treatment planning.
Keywords: breast cancer; deep learning; neoadjuvant chemotherapy; radiomics; ultrasound.
Copyright © 2025 Tenghui, Xinyi, Ziyi, Yanting, Ziqian, Yiwen and Ling.
Conflict of interest statement
The authors declare that the research was conducted in the absence of any commercial or financial relationships that could be construed as a potential conflict of interest.
Figures
Similar articles
-
Development and validation of an MRI spatiotemporal interaction model for early noninvasive prediction of neoadjuvant chemotherapy response in breast cancer: a multicentre study.EClinicalMedicine. 2025 Jun 12;85:103298. doi: 10.1016/j.eclinm.2025.103298. eCollection 2025 Jul. EClinicalMedicine. 2025. PMID: 40584836 Free PMC article.
-
Clinical benefits of deep learning-assisted ultrasound in predicting lymph node metastasis in pancreatic cancer patients.Future Oncol. 2025 Aug;21(18):2335-2345. doi: 10.1080/14796694.2025.2520149. Epub 2025 Jun 23. Future Oncol. 2025. PMID: 40548666
-
Deep learning-based radiomics does not improve residual cancer burden prediction post-chemotherapy in LIMA breast MRI trial.Eur Radiol. 2025 Aug 6. doi: 10.1007/s00330-025-11801-z. Online ahead of print. Eur Radiol. 2025. PMID: 40770139
-
Response prediction for neoadjuvant treatment in locally advanced rectal cancer patients-improvement in decision-making: A systematic review.Eur J Surg Oncol. 2025 Jul;51(7):109463. doi: 10.1016/j.ejso.2024.109463. Epub 2024 Nov 15. Eur J Surg Oncol. 2025. PMID: 39562260
-
Impact of residual disease as a prognostic factor for survival in women with advanced epithelial ovarian cancer after primary surgery.Cochrane Database Syst Rev. 2022 Sep 26;9(9):CD015048. doi: 10.1002/14651858.CD015048.pub2. Cochrane Database Syst Rev. 2022. PMID: 36161421 Free PMC article.
References
-
- Harbeck N, Nitz UA, Christgen M, Kümmel S, Braun M, Schumacher C, et al. De-escalated neoadjuvant trastuzumab-emtansine with or without endocrine therapy versus trastuzumab with endocrine therapy in HR+/HER2+ Early breast cancer: 5-year survival in the WSG-ADAPT-TP trial. J Clin Oncol: Off J Am Soc Clin Oncol. (2023) 41:3796–804. doi: 10.1200/JCO.22.01816 - DOI - PubMed
-
- Göker E, Hendriks MP, van Tilburg M, Barcaru A, Mittempergher L, van Egmond A, et al. Treatment response and 5-year distant metastasis-free survival outcome in breast cancer patients after the use of MammaPrint and BluePrint to guide preoperative systemic treatment decisions. Eur J Cancer (Oxford England: 1990). (2022) 167:92–102. doi: 10.1016/j.ejca.2022.03.003 - DOI - PubMed
-
- de Nonneville A, Houvenaeghel G, Cohen M, Sabiani L, Bannier M, Viret F, et al. Pathological complete response rate and disease-free survival after neoadjuvant chemotherapy in patients with HER2-low and HER2–0 breast cancers. Eur J Cancer (Oxford England: 1990). (2022) 176:181–8. doi: 10.1016/j.ejca.2022.09.017 - DOI - PubMed
LinkOut - more resources
Full Text Sources