. 2025 Jun 5:15:1546324.
doi: 10.3389/fonc.2025.1546324. eCollection 2025.

Imaging-based assessment of response to olaparib in platinum-sensitive relapsed ovarian cancer patients

Affiliations

Imaging-based assessment of response to olaparib in platinum-sensitive relapsed ovarian cancer patients

Maria Delgado-Ortet et al. Front Oncol. .

Abstract

Background: High-grade serous carcinoma is a highly metastatic disease with a limited longterm disease control from systemic anti-cancer treatment, for which the radiological treatment response assessment metrics are imprecise. In this work, we developed noninvasive imagingbased measurements of spatial and longitudinal heterogeneity in a retrospective analysis of a phase 2 non-randomized study of germline BRCA1/BRCA2 mutated (gBRCAm) ovarian cancer patients treated with combination of PARP inhibitors (PARPi) and immune checkpoint inhibitors (ICIs).

Methods: Lesions identified in CT images at baseline, week 4 (after PARPi only) and week 12 (after 8 weeks of PARPi + ICIs) were manually segmented. Anatomical networks of the metastatic sites were constructed to represent patterns of disease distribution. Volume and first-order radiomic features were computed and compared to different assessments of treatment response.

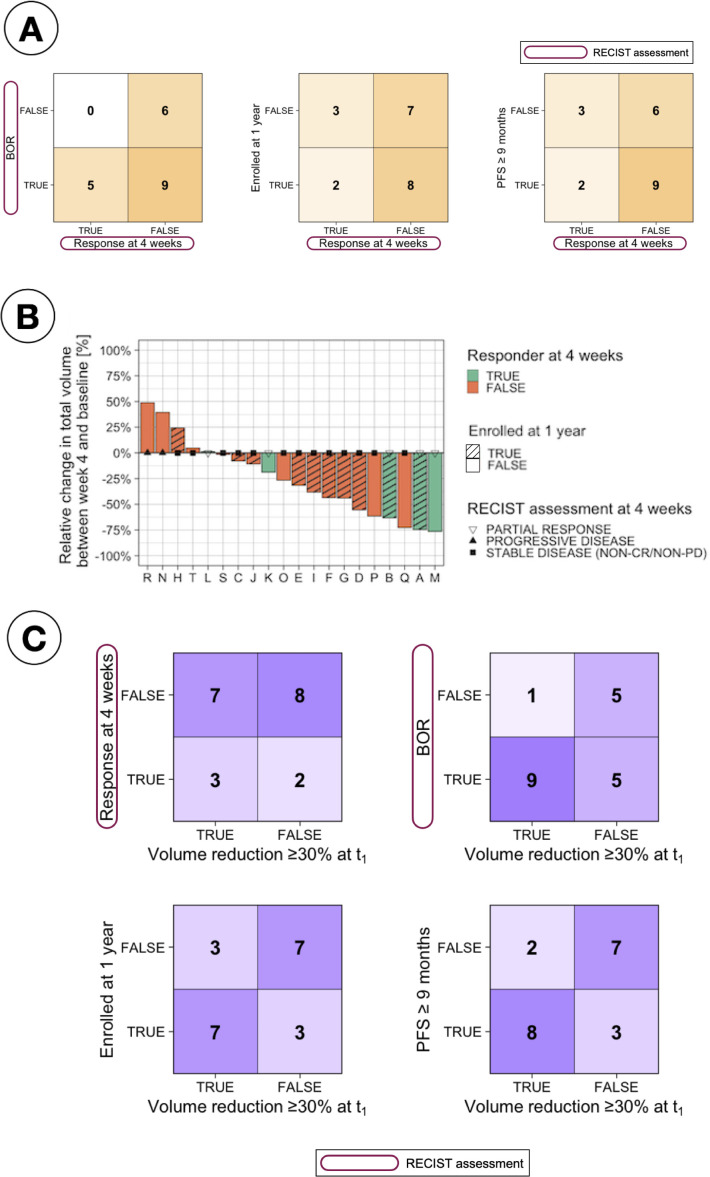
Results: The average number of edges per patient in the anatomical networks and total volumetric burden decreased with treatment were measured, differentiating between responders and nonresponders. Changes in volume at week 4 provided better indication of long-term response than the default RECIST assessment at the same time-point. Significant differences were also found between responders and non-responders in the first-order radiomic feature Energy.

Conclusions: In this feasibility study, we have demonstrated that noninvasive image-based analysis can identify quantitative imaging features associated with the response to the combination of PARPi and ICIs. These can be used to identify markers of response to ICIs from negative trials of a disease with limited response to ICIs.

Keywords: PARP inhibitors; computed tomography; immunotherapy; ovarian cancer; radiomics.


Conflict of interest statement

JB: Tailor Bio co-founder, stock options, AstraZeneca consulting and advisory roles, honoraria, Clovis Oncology consulting and advisory roles, GSK honoraria, holder of patents TAm-Seq v2 method for ctDNA estimation; enhanced detection of target DNA by fragment size analysis; methods for predicting treatment response in cancers. ES: Lucida Medical co-founder and shareholder, GE HealthCare research support, speakers’ bureau, Siemens, AWS and Philips Canon speakers’ bureau. The remaining authors declare that the research was conducted in the absence of any commercial or financial relationships that could be construed as a potential conflict of interest.

Figures

Figure 1
Figure 1
Swimmer plot of all patients (N = 20) showing all RECIST assessments, Progression Free Survival (PFS), Overall Survival (OS) and outcome PFS represents the time from treatment initiation to disease progression or death, while OS measures the time from treatment initiation to death from any cause. Patients are categorised based on RECIST response at four weeks (early responders, ER) and Best Overall Response (BOR), which is based on RECIST assessments throughout the entire study, classifying patients as responders (complete or partial response) or non-responders (stable or progressive disease). Additionally, patients are grouped by PFS length, with a cut-off at nine months, where those exceeding this threshold are considered long-term enrollees (LTE). Treatment type (PARPi or PARPi + ICB) is also indicated.
Figure 2
Figure 2
Comparison of response assessments. (A) Confusion matrices comparing RECIST response at 4 weeks with different patient stratifications, including Best Overall Response (BOR, defined as the best assessment recorded throughout the study based on RECIST criteria), long-term enrollee status (LTE, patients enrolled for ≥1 year), and progression-free survival (PFS) over nine months. (B) Waterfall plot showing relative change in total tumour volume between baseline and 4 weeks, stratified by RECIST response at 4 weeks and long-term enrollee status (LTE vs. STE, where STE refers to short-term enrollees with less than one year on study). (C) Confusion matrices evaluating the relationship between tumour volume reduction (≥30% at t1) and various response criteria, including RECIST response at 4 weeks, BOR, LTE status, and PFS ≥9 months.
Figure 3
Figure 3
Study of inter-patient metastatic sites distribution. (A) Example 2D CT slices of a single patient and time point, showing segmented lesions in the peritoneal corresponding to: Right upper quadrant (yellow, left); Left upper quadrant (orange, left); Mesentery (light yellow, right); Left paracolic gutter (salmon, both); Right paracolic gutter (cyan, right); Lesser sac transverse mesocolon (purple, left). (B) Checkers of the sites found in every patient and time point. (C) Co-occurrence matrices showing the number of patients for simultaneous sites at every time point. The sites are in framed in black by region (peritoneal, lymph nodes and other).
Figure 4
Figure 4
Anatomical networks for every response assessment. Each panel represents the anatomical connectivity of metastatic sites, where nodes correspond to lesion locations and edges indicate anatomical connections between them. The median, range (in parentheses), and mean number of edges per patient are provided for each group at t0, t1 and t2(A) At RECIST assessment at 4 weeks, Early Responders (ER) tend to have fewer edges than Non-Responders (NR) at all time points. In NR, the median number of edges remains constant over time. (B) For Best Overall Response (BOR), responders (R) maintain a stable median connectivity, while NR exhibit increasing connectivity over time. (C) Long-term enrollees (LTE) show a consistent median number of edges across timepoints, whereas Short-term enrollees (STE) experience a decline in connectivity during the second treatment arm (t1 to t2). (D) Long Responders (LR, PFS ≥ 9 months) have lower connectivity than Short Responders (SR, PFS < 9 months) at all time points, with a 50% decline in median edges at t 2.
Figure 5
Figure 5
Number of edges by response assessment measurements. Differences between groups were assessed performing Kruskal-Wallis testing and intra-group longitudinal comparisons were tested with Wilcoxon signed-rank tests.
Figure 6
Figure 6
Comparison of number of lesions per classification. (A) Number of lesions by response assessment measurements for responders vs non-responders. (B) Ratio between the number of lesions by the number of sites by response assessment measurements for responders vs non-responders.
Figure 7
Figure 7
Total volumetric responses. (A) Total volumetric burden at each time-point. (B) Percentage of total volume corresponding to peritoneal disease at each time-point. (C) Percentage volumetric change from baseline per patient, indicating the changes for different time ranges (first and second treatment arm independently and combined). (D) Scatterpies plot comparing relative changes in total volume between the two therapy arms, separating components due to peritoneal and other disease. (E) Scatterpies plot comparing relative changes in total volume between the two therapy arms, separating components due to each disease site.
Figure 8
Figure 8
(A) Total volumetric burden by treatment response assessments. Comparison of the total volumetric burden for responders vs non-responders with each different treatment response assessment: RECIST response at 4 weeks (top left), BOR (top right), enrollment length (bottom left) and PFS (bottom right). (B) Percentage of disease volumetric burden in the peritoneal cavity by treatment response assessments.
Figure 9
Figure 9
Study of radiomics features. (A) Change in radiomics features for intrapatient measurements of median, range and sum. Change in median (top), range (middle) and summed (bottom) values of the radiomics features Energy (first column), Entropy (second column) and Uniformity (third column) for all patients. (B) Comparison of the median values for energy, entropy and uniformity for the response assessments. Comparison of the median values of the radiomic features Energy (top), Entropy (middle) and Uniformity (bottom) for responders vs non-responders with each different treatment response assessment: RECIST response at 4 weeks (first column), BOR (second column), enrollment length (third column) and PFS (forth column).

Similar articles

References

    1. Lisio M-A, Fu L, Goyeneche A, Gao Z-H, Telleria C. High-grade serous ovarian cancer: basic sciences, clinical and therapeutic standpoints. Int J Mol Sci. (2019) 20:952. doi: 10.3390/ijms20040952 - DOI - PMC - PubMed
    1. Cancer Research UK (CRUK) . Statistics by cancer type (ovarian-cancer). (2013) Available at: https://www.cancerresearchuk.org/health-professional/cancer-statistics/s... (Accessed July 2023).
    1. Labidi-Galy SI, Papp E, Hallberg D, Niknafs N, Adleff V, Noe M, et al. High grade serous ovarian carcinomas originate in the fallopian tube. Nat Commun. (2017) 8:1093. doi: 10.1038/s41467-017-00962-1 - DOI - PMC - PubMed
    1. Schwarz RF, Ng CK, Cooke SL, Newman S, Temple J, Piskorz AM, et al. Spatial and temporal heterogeneity in high-grade serous ovarian cancer: a phylogenetic analysis. PloS Med. (2015) 12:e1001789. doi: 10.1371/journal.pmed.1001789 - DOI - PMC - PubMed
    1. Macintyre G, Goranova TE, De Silva D, Ennis D, Piskorz AM, Eldridge M, et al. Copy number signatures and mutational processes in ovarian carcinoma. Nat Genet. (2018) 50:1262–70. doi: 10.1038/s41588-018-0179-8 - DOI - PMC - PubMed

LinkOut - more resources