

Transcriptome analysis of historic olives reveals stress-specific biomarkers
- PMID: 40538876
- PMCID: PMC12176842
- DOI: 10.3389/fpls.2025.1549305
Transcriptome analysis of historic olives reveals stress-specific biomarkers
Abstract
Introduction: Water scarcity and soil salinization are increasingly becoming limiting factors in food production, including olives, a major fruit crop in several parts of the world. Investigating historical olives, which are the last resort for genetic resources, is essential due to their natural resilience to drought and salinity, making them valuable for breeding stress-tolerant cultivars and ensuring sustainable olive production.
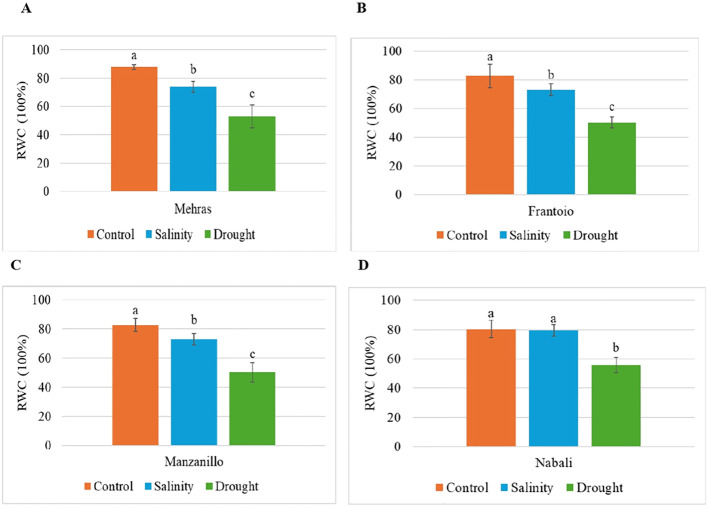
Methods: In this study, four historic olive cultivars ('Nabali', 'Mehras', 'Frantoio', and 'Manzanillo') were investigated under both drought and salinity stresses. These cultivars also preserve local biodiversity, support traditional agriculture, and offer economic opportunities through unique, heritage-based olive oils. Drought and salt stress in olives are assessed through physiological [the ratio of variable to maximum fluorescence (Fv/Fm), relative water content (RWC)], biochemical (proline content), and molecular (stress-responsive genes) analyses to evaluate stress tolerance.
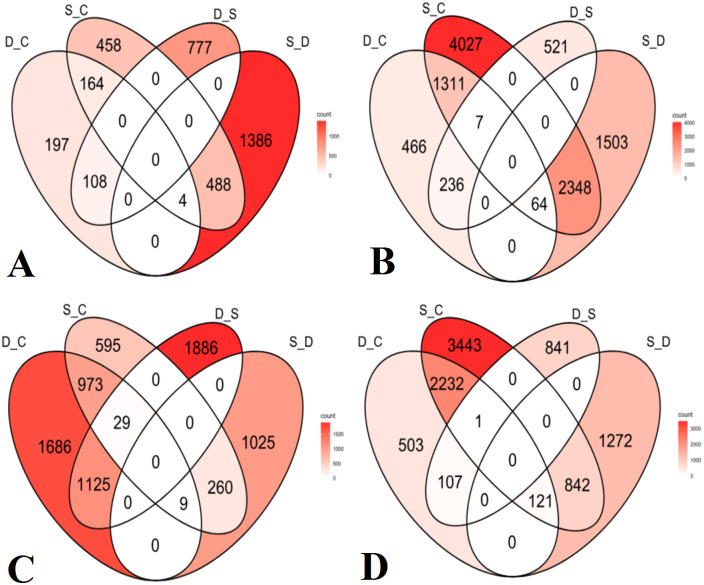
Results: Under salinity and drought stress, RWC decreased in all olive cultivars, with drought having the most severe impact. 'Nabali' exhibited the highest salinity tolerance, while all cultivars showed similar sensitivity to drought. Proline levels remained stable in 'Mehras' but decreased under salinity stress in 'Frantoio', 'Manzanillo', and 'Nabali'. Higher proline accumulation under drought suggested better drought tolerance than salinity in these cultivars. Photosynthetic efficiency (Fv/Fm) declined under salinity and drought stress in all cultivars, with drought causing a more significant reduction. 'Manzanillo' showed the highest sensitivity to drought, while the other cultivars maintained moderate efficiency under stress. 'Manzanillo' and 'Mehras' exhibited the highest number of differentially expressed genes (DEGs) under both drought and salinity stress, with 'Manzanillo' showing 2,934 DEGs under drought and 664 under salinity stress, while 'Mehras' had 2,034 and 2,866 DEGs, respectively. 'Nabali' demonstrated the strongest salinity-specific response, with 3,803 DEGs under salinity stress compared to 1,346 under drought. 'Frantoio' consistently had the lowest number of DEGs, with 345 under drought and 512 under salinity stress, indicating a more stable transcriptional response. Comparative analyses between drought and salinity conditions revealed significant variations, with 'Manzanillo' showing 2,599 unique DEGs under drought relative to salinity stress, while 'Nabali' exhibited 2,666 DEGs under salinity stress relative to drought. The major novel upregulated genes under salinity stress were Xyloglucan endotransglucosylase hydrolase (7 fold in 'Nabali' and 6.9 fold in 'Mehras'). The novel drought genes detected in 'Frantoio' included Phytosulfokines 3 (4.9 fold), while Allene oxide synthase (6.5 fold) and U-box domain-containing (6.4 fold) were detected in 'Manzanillo'.
Discussion: The data revealed both novel and common stress-specific biomarkers under both salinity and drought stress, which can potentially be utilized in olive breeding and genetic improvement programs to mitigate stress.
Keywords: DEG; biomarkers; drought; olive; salinity.
Copyright © 2025 Alkhatatbeh, Sadder, Haddad, Al-Amad, Brake, Alsakarneh and Alnajjar.
Conflict of interest statement
Author NH was employed by the company Del Monte. The remaining authors declare that the research was conducted in the absence of any commercial or financial relationships that could be construed as a potential conflict of interest.
Figures


References
-
- Al-Qinna M. I., Hammouri N. A., Obeidat M. M., Ahmad F. Y. (2011). Drought analysis in Jordan under current and future climates. Climatic Change 106, 421–440. doi: 10.1007/s10584-010-9954-y - DOI
-
- Ateyyeh A. F., Sadder M. T. (2006). Phylogenic clustering of three Jordanian olive (Olea europaea L.) cultivars within international collection. Adv. Hortic. Sci. 20, 170–174.
-
- Ayala-Astorga G. I., Alcaraz-Meléndez L. (2010). Salinity effects on protein content, lipid peroxidation, pigments, and proline in Paulownia imperialis (Siebold & Zuccarini) and Paulownia fortunei (Seemann & Hemsley) grown in vitro . Electronic J. Biotechnol. 13, 13–14. doi: 10.2225/vol13-issue5-fulltext-13 - DOI
-
- Baccari S., Rkhis A. C., Chaabouni A. C., Maalej M., Abdallah F. B. (2016). Response of olive (Olea europaea) seedlings to in vitro water stress induced by polyethylene glycol. J. New Sci. IABC (7), 1241–1246.
-
- Banuls J., Primo-Millo E. (1992). Effects of chloride and sodium on gas exchange parameters and water relations of Citrus plants. Physiologia Plantarum 86, 115–123. doi: 10.1111/j.1399-3054.1992.tb01319.x - DOI
LinkOut - more resources
Full Text Sources