. 2025 Jun 5:16:1582982.
doi: 10.3389/fimmu.2025.1582982. eCollection 2025.

Unveiling regulatory variants in the blood transcriptome and their association with immunity traits in pigs

Affiliations

Unveiling regulatory variants in the blood transcriptome and their association with immunity traits in pigs

Teodor Jové-Juncà et al. Front Immunol. .

Abstract

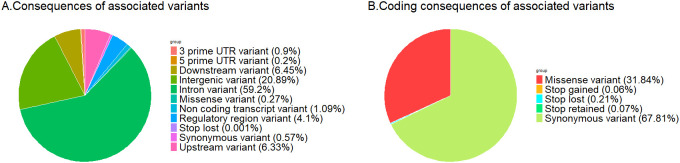
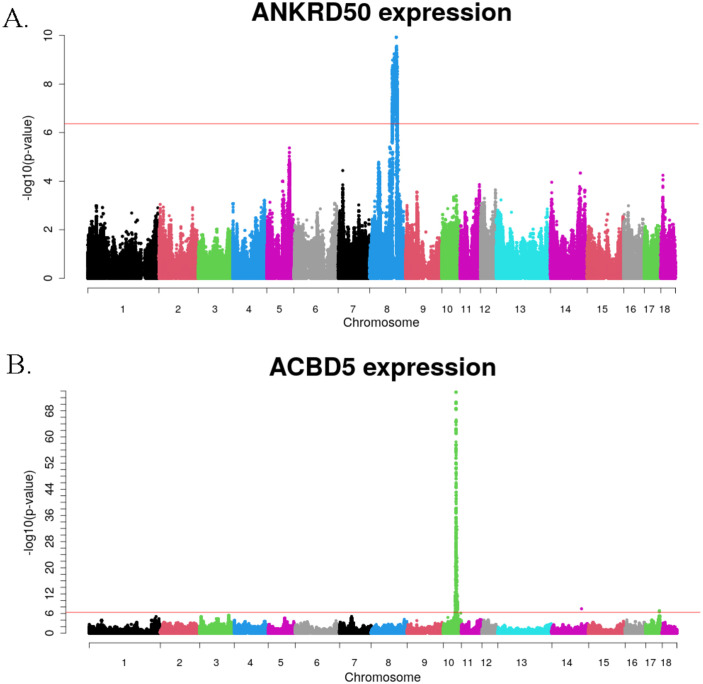
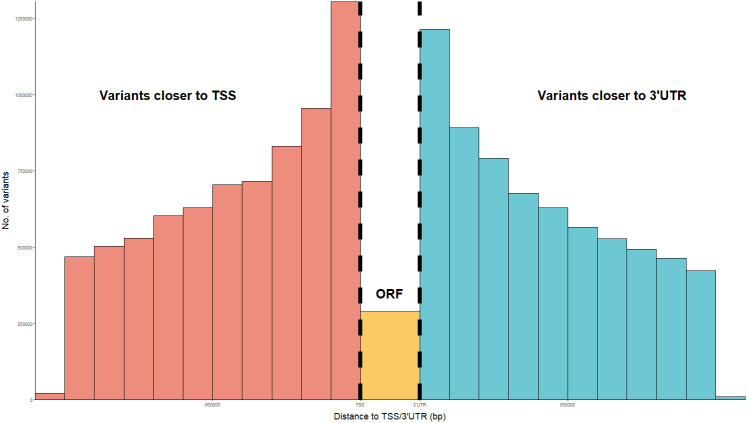
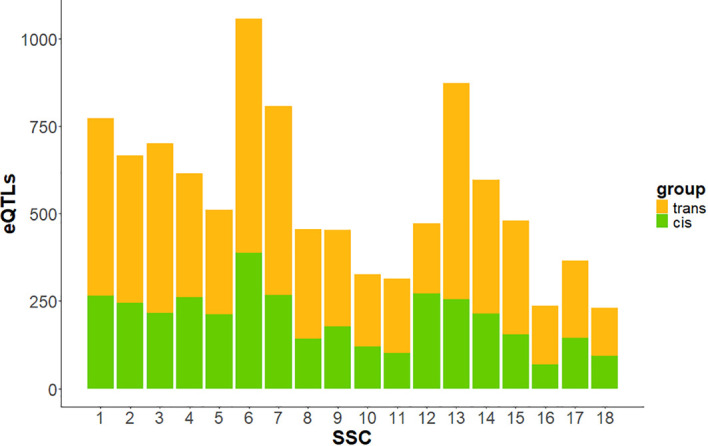
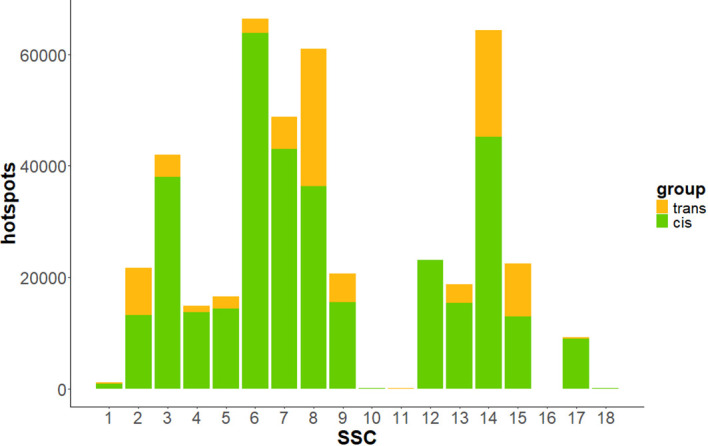
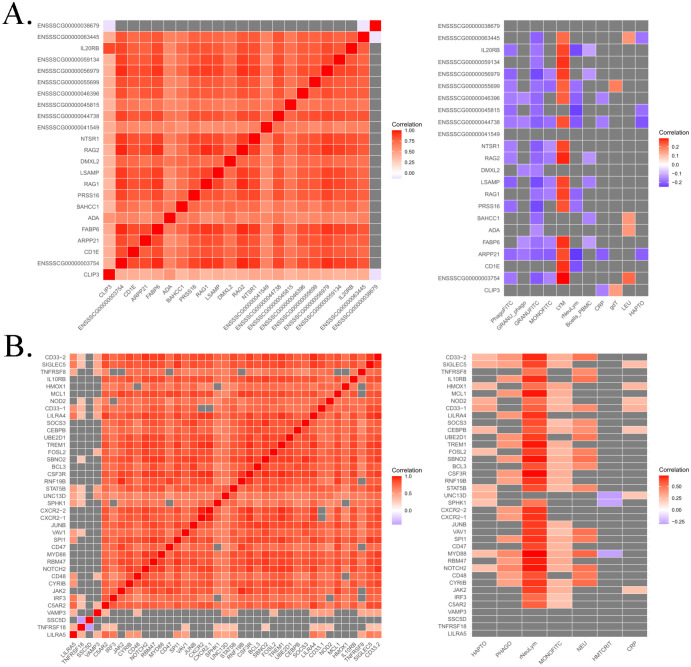
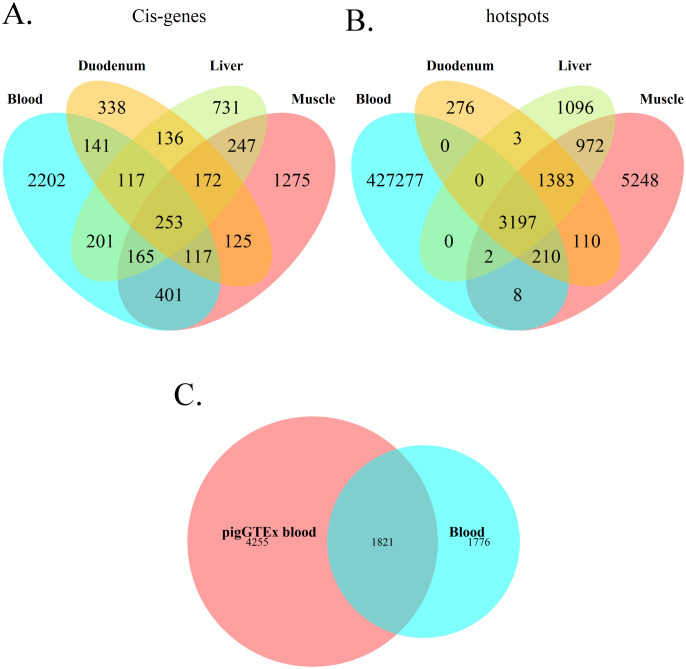
Genome wide association studies (GWAS) have been widely used to investigate the association of genetic markers with complex traits in both humans and livestock species. A particular trait of interest, when studying animal robustness and general immunocompetence, is the transcriptomic profile of blood. To identify genetic variants affecting gene expression in pig blood, we performed expression GWAS (eGWAS) in 255 animals from a commercial Duroc population between 8,499,177 imputed single nucleotide polymorphisms (SNPs) and the expression levels of 14,642 genes obtained from RNA sequencing. Out of the nearly 125 million associations tested, 23 million were found to be significant, grouped in 9,930 expression quantitative trait loci (eQTLs) associated to the expression levels of 6,051 genes. Over 36% of detected eQTLs mapped in close proximity to the genomic location of their associated gene and were classified as cis-eQTLs. Moreover, 430,694 variants were found to be associated with the expression of 10 or more different genes and were annotated as transcriptional hotspots. Among genes regulated by these hotspots, we identified genes that encode transcription factors and co-factors regulating immune responses, such as ARNT, or co-expressed genes related to immunity (CSF3R, JAK2, SOCS3, STAT5B and UBE2D1) and associated with health traits, such as phagocytic activity or haptoglobin concentration. In addition, several of the cis-regulating variants for immunity candidate genes overlapped with previously described immunity QTLs. Colocalization studies revealed putative common causal variants between the proportion of memory and helper T cells and the candidate genes CLEC12B, IGKV2D, KLRC1, KLRD1 and ZAP70. In conclusion, the associations identified in this study enable the characterization of transcriptional regulators of the pig blood transcriptome. Moreover, the colocalization between immunity QTLs and eQTLs has revealed potential causative mutations regulating immunocompetence in pigs. All these data and results contribute to shedding light on the regulatory mechanisms of blood gene expression and porcine immune regulation.

Keywords: RNA-seq; SNP; eGWAS; gene expression; immune system; lymphocytes; swine.


Conflict of interest statement

Author DC-P was employed by company Cuarte S.L., Spain. The remaining authors declare that the research was conducted in the absence of any commercial or financial relationships that could be construed as a potential conflict of interest.

Figures

Figure 1
Figure 1
Pie chart presenting the consequences of genetic variants associated to blood gene expression levels (A) all associated variants; (B) variants in coding regions.
Figure 2
Figure 2
Manhattan plots of eGWAS results for ANKRD50 (A), and ACBD5 (B) expression levels. The red threshold corresponds to an adjusted p-value of 0.05 after Bonferroni correction for multiple testing.
Figure 3
Figure 3
Distribution of the distance between cis regulatory variants and their regulated gene ORF, in bp. Distances have been calculated as relative to the transcription start site (TSS) or start of the 3’ untranslated regions (3’UTR), whichever closest. The number of regulatory variants located inside the ORF between the TSS and start of 3’UTR has been plotted in orange.
Figure 4
Figure 4
Bar plot showing the number of cis- and trans-eQTLs across autosomes. In green, eQTLs annotated in cis- to their associated gene; in orange, eQTLs annotated in trans- to their associated gene.
Figure 5
Figure 5
Bar plot depicting the distribution of cis- and trans-hotspots across autosomes. In green, hotspots annotated in cis to at least one of its associated genes; in orange hotspots annotated in trans to all its associated genes. Chromosomes SSC10, SSC11 and SSC18, with less than 150 hotspots, were not plotted due to the relative bar size.
Figure 6
Figure 6
Heatmap of partial correlations from PCIT analysis between the expression levels of genes regulated by top-hotspots in SSC1 (A) and SSC6 (B), as well as their correlations with immunity traits. Positive correlations are presented in red, negative ones in blue, and non-significant correlations in grey.
Figure 7
Figure 7
Venn diagrams depicting the overlap of results regarding porcine blood transcriptome with other studies. (A) Overlap between genes regulated by a cis eQTL in blood and those in duodenum, muscle and liver from Crespo-Piazuelo et al. (6) and the present work. (B) Overlap between regulatory hotspots for blood transcriptome and those for duodenum, muscle and liver from Crespo-Piazuelo et al. (6). (C) Overlap between genes regulated in blood by a cis eQTL in the present study and the PigGTEx project (13).

Similar articles

References

    1. Hindorff LA, Sethupathy P, Junkins HA, Ramos EM, Mehta JP, Collins FS, et al. Potential etiologic and functional implications of genome-wide association loci for human diseases and traits. Proc Natl Acad Sci U S A. (2009) 106:9362–7. doi: 10.1073/PNAS.0903103106 - DOI - PMC - PubMed
    1. Maurano MT, Humbert R, Rynes E, Thurman RE, Haugen E, Wang H, et al. Systematic localization of common disease-associated variation in regulatory DNA. Science. (2012) 337:1190–5. doi: 10.1126/SCIENCE.1222794 - DOI - PMC - PubMed
    1. Ward LD, Kellis M. Interpreting noncoding genetic variation in complex traits and human disease. Nat Biotechnol. (2012) 30:1095–106. doi: 10.1038/NBT.2422 - DOI - PMC - PubMed
    1. Stranger BE, Nica AC, Forrest MS, Dimas A, Bird CP, Beazley C, et al. Population genomics of human gene expression. Nat Genet. (2007) 39:1217–24. doi: 10.1038/NG2142 - DOI - PMC - PubMed
    1. Ardlie KG, DeLuca DS, Segrè AV, Sullivan TJ, Young TR, Gelfand ET, et al. Human genomics. The Genotype-Tissue Expression (GTEx) pilot analysis: multitissue gene regulation in humans. Science. (2015) 348:648–60. doi: 10.1126/SCIENCE.1262110 - DOI - PMC - PubMed

LinkOut - more resources