. 2025 Jun 5:16:1574006.
doi: 10.3389/fimmu.2025.1574006. eCollection 2025.

Brucella infection induces chromatin restructuring in host cells to activate immune responses

Affiliations

Brucella infection induces chromatin restructuring in host cells to activate immune responses

Dejian Xie et al. Front Immunol. .

Abstract

Background: Brucella spp., facultative intracellular pathogens that cause brucellosis, drive pathogenesis by invading host cells and establishing intracellular persistence. While their molecular mechanisms are well-characterized, how Brucella induces chromatin restructuring in host cells remains poorly understood, representing a critical gap in host-pathogen interaction research.

Methods: Using an established in vitro infection model of Brucella-infected RAW264.7 murine macrophages, we integrated Hi-C, ATAC-seq, and RNA-seq to generate multi-omics datasets. Multidimensional comparative genomics approaches were employed to systematically map infection-induced changes in host chromatin architecture and functional genomic organization.

Results: Our findings unveiled substantial alterations in the host chromatin architecture, characterized by a reduction in B-B compartment regions interactions, an increase in A-B compartment interactions, and diminished long-range chromatin contacts. Crucially, Brucella reshaped chromatin compartmentalization, activating interferon-stimulated genes (ISGs) in regions transitioning from compartment B to A. Enhanced sub-TADs interactions within ISG clusters further facilitated their coordinated expression. Additionally, infection remodeled chromatin loop structures, strengthening interactions linked to immune-related gene activation.

Conclusion: These results demonstrate that host cells undergo substantial chromatin remodeling during acute Brucella infection as a defense mechanism against pathogen invasion. Our findings provide critical insights into host-pathogen interactions and suggest potential epigenetic targets for managing brucellosis.

Keywords: 3D genome; Brucella; chromatin restructuring; host-pathogen interactions; interferon-stimulated genes.


Conflict of interest statement

The authors declare that the research was conducted in the absence of any commercial or financial relationships that could be construed as a potential conflict of interest.

Figures
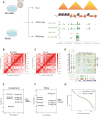
Figure 1
Figure 1
Brucella infection restructures the host cell genome. (A) Experimental design of the study. The figure outlines the overall experimental framework, including sample preparation, infection conditions, and analytical workflows for Hi-C, ATAC-Seq, and RNA-Seq analyses. (B) Interaction map of chromosome 17 in the Brucella-infected group, with a resolution of 200 kb. The heatmap represents the frequency of interactions between genomic regions, with warmer colors indicating higher interaction frequencies. (C) Interaction map of chromosome 17 in the mock-treated group, with a resolution of 200 kb. The heatmap represents the frequency of interactions between genomic regions, with warmer colors indicating higher interaction frequencies. (D) Differential interaction map of chromosome 17 between the Brucella-infected and mock-treated groups. The z-score difference map highlights regions with significant changes in interaction frequency. Yellow areas represent increased interactions in the infected group, while green areas represent decreased interactions in the infected group. (E) PCA of compartment PC1 values in samples from the Brucella-infected and mock-treated groups. The plot illustrates the separation of samples based on PC1 of compartmentalization, highlighting changes in chromatin compartment structure. (F) PCA of insulation scores in samples from the Brucella-infected and mock-treated groups. The plot illustrates the separation of samples based on the PC1 of insulation scores, highlighting changes in TAD boundary strength. (G) P(s) curve analysis. The figure shows the relationship between the Hi-C contact frequency (P) of intrachromosomal interactions sorted by genomic distance (s) for the Brucella-infected group (tomato) and the mock-treated group (green). The curve illustrates the decay of interaction frequency with increasing genomic distance, highlighting differences in chromatin interaction patterns between the two conditions.
Figure 2
Figure 2
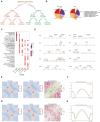
Brucella infection promotes the activation of immune genes. (A) Volcano plot depicting differentially expressed genes (DEGs) in response to Brucella infection. The plot illustrates the statistical significance (−log10 P-value) versus the fold change of gene expression, highlighting genes that are significantly upregulated and downregulated. (B) Bar plot displays the top 10 significantly enriched biological processes (GO terms) from DEGs between Brucella-infected and mock-infected groups. Blue bars represent Brucella-specific DEG enrichments, while red bars indicate mock-specific DEG enrichments. (C) Gene Set Enrichment Analysis (GSEA) enrichment plot showing significant overrepresentation of genes associated with the JAK-STAT signaling pathway. The plot highlights the enrichment score and the position of genes within the ranked list. (D) Heatmap of ISGs expression between Brucella-infected and mock-infected groups. The color bar represents the expression levels normalized by z-score, illustrating the relative expression changes across samples. (E) Simplified network diagram summarizing the GSEA results. The diagram illustrates key pathways and gene sets that are significantly enriched in response to Brucella infection, highlighting the interconnectedness of immune signaling pathways.
Figure 3
Figure 3
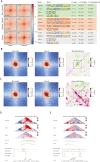
Brucella infection alters chromatin compartmentalization to promote activation of interferon-stimulated genes. (A) Saddle plot depicting chromatin compartmentalization between genomic regions, sorted by E1 score (the genome is divided into a total of 50 bins). A-A interactions are shown in the bottom right corner, while A-B interactions are located in the top right and bottom left corners. The right panel displays the log2(Brucella/Mock) difference score, highlighting changes in interaction frequencies between the two groups. (B) Pie chart illustrating the proportion of conserved and changed A/B compartments before and after infection. The chart provides an overview of the relative abundance of genomic regions that remain stable versus those that transition between compartments. (C) Gene Ontology (GO) annotations for upregulated genes in regions where B compartments transition to A compartments after infection. The analysis reveals enriched terms associated with immune response and signaling pathways, highlighting the functional relevance of these chromatin transitions. (D) Heatmap illustrating the changes in PC1 of ISG gene loci. The figure displays the Compartment PC1 values of specific gene promoter loci in the Mock and Brucella groups, normalized by z-score. The heatmap highlights shifts in chromatin compartmentalization associated with ISG activation. (E) Multi-omics data visualization for the chr1:173.2-173.8M region. In the interaction heatmap, the signals for both Brucella-infected and Mock samples were normalized by Z-score, while the Delta heatmap represents the differential interactions between Brucella and Mock groups (red: stronger interactions in Brucella; blue: stronger interactions in Mock). The ATAC track and RNA track show chromatin accessibility (ATAC-seq signal) and transcriptional activity (RNA-seq signal) in the region. The Brucella_IS and Mock_IS tracks display the insulation score (IS) signals of topologically associating domains in Brucella-infected and Mock control groups, respectively. The Brucella_PC1 and Mock_PC1 tracks represent the first principal component (PC1) signals in compartment analysis, with red indicating A compartments and blue denoting B compartments, respectively, while the Gene track annotates the genomic positions of genes. (F) Multi-omics data visualization for the chr5:105-106M region. In the interaction heatmap, the signals for both Brucella-infected and Mock samples were normalized by Z-score, while the Delta heatmap represents the differential interactions between Brucella and Mock groups (red: stronger interactions in Brucella; blue: stronger interactions in Mock). The ATAC track and RNA track show chromatin accessibility (ATAC-seq signal) and transcriptional activity (RNA-seq signal) in the region. The Brucella_IS and Mock_IS tracks display the insulation score (IS) signals of topologically associating domains in Brucella-infected and Mock control groups, respectively. The Brucella_PC1 and Mock_PC1 tracks represent the first principal component (PC1) signals in compartment analysis, with red indicating A compartments and blue denoting B compartments, respectively, while the Gene track annotates the genomic positions of genes.
Figure 4
Figure 4
Changes in chromatin conformation promote coordinated activation of immune gene clusters. (A) Schematic representation of the strategy for identifying gene clusters, polymorphic gene loci, and independent gene loci. The approach involves systematic screening and categorization based on differential expression and chromatin interaction data. (B) Pie chart illustrating the distribution and proportion of gene loci identified in the study. The chart provides an overview of the relative abundance of different gene types within the dataset. (C) Dot plot displaying Gene Ontology annotations for six distinct categories of genes. The analysis reveals enrichment patterns, with the exception of Down_Cluster_Gene, which did not show significant enrichment under the specified screening conditions. (D) Visualization of selected gene clusters, with upregulated genes highlighted in red. The figure provides a spatial representation of gene loci and their expression status post-infection. (E) Analysis of intra-TAD interactions in the Upgene_Cluster_locus region using Aggregate Domain Analysis (ADA). The figure shows increased interaction frequency within this region after infection, with the dashed area indicating the sub-TADs. The left panel displays the stacking results in the Brucella group, the middle panel in the Mock group, and the right panel shows the log2 processing of the Brucella/Mock aggregate contact frequency. Green shading indicates regions with increased interaction frequency post-infection. (F) Post-infection, the average insulation index of the sub-TADs region containing UpGene_Cluster_Gene_locus is slightly upregulated. The figure illustrates the subtle changes in insulation scores, reflecting alterations in chromatin organization. (G) Analysis of intra-TAD interactions in the Downgene_Cluster_Gene_locus region using ADA. The figure shows changes in interaction frequency within this region after infection, with the dashed area indicating the sub-TADs. The left panel displays the stacking results in the Brucella group, the middle panel in the Mock group, and the right panel shows the log2 processing of the Brucella/Mock aggregate contact frequency. Red shading indicates regions with decreased interaction frequency post-infection. (H) Post-infection, the average insulation index of the sub-TADs region containing DownGene_Cluster_Gene_locus is significantly reduced. The figure highlights substantial changes in insulation scores, reflecting significant alterations in chromatin organization and potential regulatory impacts on gene expression.
Figure 5
Figure 5
Brucella infection modulates chromatin looping interactions. (A) Aggregate Peak Analysis (APA) depicting the enrichment peaks and motif annotations of specific and conserved chromatin loops before and after Brucella infection. The figure displays the top four results, highlighting the most significant changes in loop interactions and associated motifs. (B) APA illustrating the enrichment peaks and differences of loops associated with upregulated genes following Brucella infection. Enhanced loop anchor interactions are indicated in green, reflecting increased chromatin interaction strength. (C) APA illustrating the enrichment peaks and differences of loops associated with downregulated genes following Brucella infection. Weakened loop anchor interactions are indicated in red, reflecting decreased chromatin interaction strength. (D) Multi-omics data visualization for the chr11:81.9-82.2M region. In the interaction heatmap, the signals for both Brucella-infected and Mock samples were normalized by Z-score, while the Delta heatmap represents the differential interactions between Brucella and Mock groups (red: stronger interactions in Brucella; blue: stronger interactions in Mock). The Loop track displays the identified chromatin loops, with the connecting line width indicating the loop’s q-value (statistical significance). The triangular arrows indicate the orientation of CTCF motifs, with red arrows representing the forward (+) direction and blue arrows denoting the reverse (-) direction. The ATAC track and RNA track show chromatin accessibility (ATAC-seq signal) and transcriptional activity (RNA-seq signal) in the region, respectively, while the Gene track annotates the genomic positions of genes. (E) Multi-omics data visualization for the chr3:142.2-143M region. T In the interaction heatmap, the signals for both Brucella-infected and Mock samples were normalized by Z-score, while the Delta heatmap represents the differential interactions between Brucella and Mock groups (red: stronger interactions in Brucella; blue: stronger interactions in Mock). The Loop track displays the identified chromatin loops, with the connecting line width indicating the loop’s q-value (statistical significance). The triangular arrows indicate the orientation of CTCF motifs, with red arrows representing the forward (+) direction and blue arrows denoting the reverse (-) direction. The ATAC track and RNA track show chromatin accessibility (ATAC-seq signal) and transcriptional activity (RNA-seq signal) in the region, respectively, while the Gene track annotates the genomic positions of genes.
Figure 6
Figure 6
Brucella infection induces chromatin restructuring in host cells to activate immune responses.

Similar articles

References

    1. Laine CG, Johnson VE, Scott HM, Arenas-Gamboa AM. Global estimate of human brucellosis incidence. Emerg Infect Dis. (2023) 29:1789–1797. doi: 10.3201/eid2909.230052 - DOI - PMC - PubMed
    1. Dean AS, Crump L, Greter H, Hattendorf J, Schelling E, Zinsstag J. Clinical manifestations of human brucellosis: a systematic review and meta-analysis. PLoS Negl Trop Dis. (2016) 6:e1929. doi: 10.1371/journal.pntd.0001929 - DOI - PMC - PubMed
    1. Celli J, de Chastellier C, Franchini D-M, Pizarro-Cerda J, Moreno E, Gorvel J-P. Brucella evades macrophage killing via virb-dependent sustained interactions with the endoplasmic reticulum. J Exp Med. (2003) 198:545–56. doi: 10.1084/jem.20030088 - DOI - PMC - PubMed
    1. Casanova J-L, MacMicking JD, Nathan CF. Interferon-γ and infectious diseases: Lessons and prospects. Science. (2024) 384:eadl2016. doi: 10.1126/science.adl2016 - DOI - PubMed
    1. Rowley MJ, Corces VG. Organizational principles of 3d genome architecture. Nat Rev Genet. (2018) 19:789–800. doi: 10.1038/s41576-018-0060-8 - DOI - PMC - PubMed

LinkOut - more resources