. 2024 Nov 20;5(2):167-180.
doi: 10.5194/mr-5-167-2024. eCollection 2024.

Workflow for systematic design of electrochemical in operando NMR cells by matching B 0 and B 1 field simulations with experiments

Affiliations

Workflow for systematic design of electrochemical in operando NMR cells by matching B 0 and B 1 field simulations with experiments

Michael Schatz et al. Magn Reson (Gott). .

Abstract

Combining electrochemistry (EC) and nuclear magnetic resonance (NMR) techniques has evolved from a challenging concept to an adaptable and versatile method for battery and electrolysis research. Continuous advancements in NMR hardware have fostered improved homogeneity of the static magnetic field, B 0 , and the radio frequency field, B 1 , yet fundamental challenges caused by introducing essential conductive components into the NMR sensitive volume remain. Cell designs in EC-NMR have largely been improved empirically, at times supported by magnetic field simulations. To propel systematic improvements of cell concepts, a workflow for a qualitative and semi-quantitative description of both B 0 and B 1 distortions is provided in this study. Three-dimensional finite element method (FEM) simulations of both B 0 and B 1 fields were employed to investigate cell structures with electrodes oriented perpendicular to B 0 , which allow realistic EC-NMR measurements for battery and electrolysis applications. Particular attention is paid to field distributions in the immediate vicinity of electrodes, which is of prime interest for electrochemical processes. Using a cell with a small void outside the electrochemical active region, the relevance of design details and bubble formation is demonstrated. Moreover, B 1 amplifications in coin cells provide an explanation for unexpectedly high sensitivity in previous EC-NMR studies, implying the potential for selective excitation of spins close to electrode surfaces. The correlation of this amplification effect with coin geometry is described by empirical expressions. The simulations were validated experimentally utilising frequency-encoded 1H profile imaging and chemical shift imaging of 1H, 13C, and 23Na resonances of NaHCO 3 electrolyte. Finally, the theoretical and experimental results are distilled into design guidelines for EC-NMR cells.


Conflict of interest statement

The contact author has declared that none of the authors has any competing interests.

Figures

Figure 1
Figure 1
(a–b) Sectional side view of experimental setup for investigations of changes in the B0 field without and with electrolyte in the notch underneath the Cu WE, respectively. (c) Technical drawing with exact dimensions given.
Figure 2
Figure 2
(a–b) Sectional view of the experimental coin cell setup for investigations of changes in the B1 field with PEEK and Cu discs, respectively. (c) Technical drawing of the sectional view with exact dimensions given. (d) Setup in FEM simulations using EMpro showing the RF coils and the resulting B1 field direction parallel to the discs.
Figure 3
Figure 3
Spatially resolved NMR spectra of CSI measurements of experimental setups (a–c) without Cu foil, (e–g) with Cu foil and air underneath, and (i–k) with Cu foil and electrolyte underneath, depicted between z=[0,2] mm. Spectra are shown for 1H, 13C, and 23Na, respectively. Simulated B0 distortions, represented by histograms over the same z interval, for the case of (d) no Cu foil and water filled notch, (h) air, and (l) water underneath the Cu foil, respectively. The histograms were corrected under the assumption of perfect shimming of the sample without Cu foil.
Figure 4
Figure 4
(a–b)  B1 field intensities in layers exactly on top of the Cu disc and 50 µ m above it, respectively. (c)  B1 field intensities in the sectional side view through the Cu disc. The magnitude of B1 field was calculated considering all components of the three-dimensional vector. (d) Frequency-encoded 1H density profile of the experimental setup with horizontally placed Cu foil. For the imaging experiment, a pulse length of 16.5 µ s was used, while the 90° pulse duration was 18.5 µ s. Thus, increased intensities close to the electrode at z=0 mm can be correlated to local enhancement of B1 field.
Figure 5
Figure 5
Spatial distribution of calculated B1 field in a central sectional plane perpendicular to the coin surface with coins of (a) 1 mm distance and 1 mm thickness, (b) 0.1 mm distance and 1 mm thickness, (c) 1 mm distance and 5 mm thickness, and (d) 0.1 mm distance and 5 mm thickness. The origin of the z axis is centred between the two coins, whose edges are marked by white, dashed lines. (e) Histogram of B1 field intensities between the coins for the four presented calculations. A simulation without conductive coins (see “empty”) serves as a reference case to quantify B1 field enhancement. All histograms were normalised; therefore all integrals are equal.
Figure 6
Figure 6
(a) Calculated B1 field from simulations in a line along the x axis, parallel to and central between the coin surfaces. The calculated B1 field in an empty volume without conductive coins is plotted as a reference. (b) RF amplification in comparison to B1 field in an empty volume for two extreme conditions: For a coin distance of 0.05 mm, thickness was varied between [0.05, 0.1, 0.5, 1, 2, 3, 4, 5] mm. For a coin thickness of 5 mm, distance was varied between [0.05, 0.1, 0.5, 1, 2, 3, 4, 5] mm. Dashed lines represent exponential fits to the data.
Figure A1
Figure A1
Simulated B0 distortions, represented by histograms over the z axis, for the case of (a) no Cu foil and electrolyte-filled notch, (b) air, and (c) electrolyte underneath the Cu foil, respectively. The histograms were not corrected in terms of shimming.
Figure B1
Figure B1
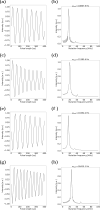
(a, c, e, g) Nutation curves and (b, d, f, h) nutation spectra of the 1H water resonance in nutation experiments with coin cell setups with 1 mm electrode distance, respectively. (a–b) PEEK discs with 1 mm thickness. (c–d) Cu discs with 1 mm thickness. (e–f) PEEK discs with 5 mm thickness. (g–h) Cu discs with 5 mm thickness. The point with highest intensity in nutation spectra is selected as the nutation frequency. Numerically exactly matching values are due to the limited number of 80 discrete points of the nutation curve.
Figure B2
Figure B2
(a, c, e, g) Nutation curves and (b, d, f, h) nutation spectra of the 1H water resonance in nutation experiments with coin cell setups with 0.1 mm electrode distance, respectively. (a–b) PEEK discs with 1 mm thickness. (c–d) Cu discs with 1 mm thickness. (e–f) PEEK discs with 5 mm thickness. (g–h) Cu discs with 5 mm thickness. The point with highest intensity in nutation spectra is selected as the nutation frequency. Numerically exactly matching values are due to the limited number of 80 discrete points of the nutation curve.
Figure B3
Figure B3
Calculated B1 field from simulations in a central line along the x axis, parallel to the coin surface. (a) For a coin distance of 0.05 mm, thickness was increased in the order [0.05, 0.1, 0.5, 1, 2, 3, 4, 5] mm, indicated with changing colour from green to blue. (b) For a coin thickness of 5 mm, distance was decreased in the order [5, 4, 3, 2, 1, 0.5, 0.1, 0.05] mm, indicated with changing colour from green to blue.
Figure D1
Figure D1
Calculated B1 field from simulations using the electrodes of coin cells as the RF coil. The magnitude of B1 field in the xz plane between coins with 1 mm distance is depicted for electrode thickness of (a) 1 mm and (b) 0.1 mm. (c) Mean field averaged over the z axis plotted over the x axis for electrode thickness of 1 mm and 0.1 mm.

Similar articles

References

    1. Aguilera AR, MacMillan B, Krachkovskiy S, Sanders KJ, Alkhayri F, Adam Dyker C, Goward GR, Balcom BJ. A parallel-plate RF probe and battery cartridge for 7Li ion battery studies. J Magn Reson. 2021;325:106943. doi: 10.1016/j.jmr.2021.106943. - DOI - PubMed
    1. Bazak JD, Allen JP, Krachkovskiy SA, Goward GR. Mapping of Lithium-Ion Battery Electrolyte Transport Properties and Limiting Currents with In Situ MRI. J Electrochem Soc. 2020;167:140518. doi: 10.1149/1945-7111/abc0c9. - DOI
    1. Benders S, Gomes BF, Carmo M, Colnago LA, Blümich B. In-situ MRI velocimetry of the magnetohydrodynamic effect in electrochemical cells. J Magn Reson. 2020;312:106692. doi: 10.1016/j.jmr.2020.106692. - DOI - PubMed
    1. Bhattacharyya R, Key B, Chen H, Best AS, Hollenkamp AF, Grey CP. In situ NMR observation of the formation of metallic lithium microstructures in lithium batteries. Nat Mater. 2010;9:504–510. doi: 10.1038/nmat2764. - DOI - PubMed
    1. Borzutzki K, Brunklaus G. In: in: Annual Reports on NMR Spectroscopy, Vol 91. Webb GA, editor. Academic Press; 2017. Chapter Three – Magnetic Resonance Imaging Studies of the Spatial Distribution of Charge Carriers; pp. 115–141. - DOI

LinkOut - more resources