

Constraint-based modeling of bioenergetic differences between synaptic and non-synaptic components of dopaminergic neurons in Parkinson's disease
- PMID: 40539219
- PMCID: PMC12176876
- DOI: 10.3389/fncom.2025.1594330
Constraint-based modeling of bioenergetic differences between synaptic and non-synaptic components of dopaminergic neurons in Parkinson's disease
Abstract
Introduction: Emerging evidence suggests that different metabolic characteristics, particularly bioenergetic differences, between the synaptic terminal and soma may contribute to the selective vulnerability of dopaminergic neurons in patients with Parkinson's disease (PD).
Method: To investigate the metabolic differences, we generated four thermodynamically flux-consistent metabolic models representing the synaptic and non-synaptic (somatic) components under both control and PD conditions. Differences in bioenergetic features and metabolite exchanges were analyzed between these models to explore potential mechanisms underlying the selective vulnerability of dopaminergic neurons. Bioenergetic rescue analyses were performed to identify potential therapeutic targets for mitigating observed energy failure and metabolic dysfunction in PD models.
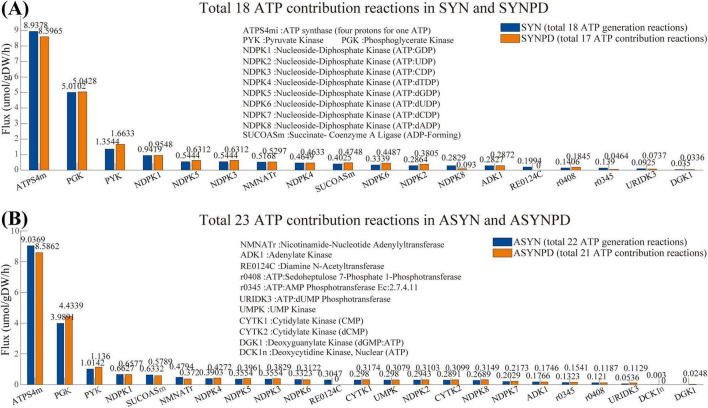
Results: All models predicted that oxidative phosphorylation plays a significant role under lower energy demand, while glycolysis predominates when energy demand exceeds mitochondrial constraints. The synaptic PD model predicted a lower mitochondrial energy contribution and higher sensitivity to Complex I inhibition compared to the non-synaptic PD model. Both PD models predicted reduced uptake of lysine and lactate, indicating coordinated metabolic processes between these components. In contrast, decreased methionine and urea uptake was exclusively predicted in the synaptic PD model, while decreased histidine and glyceric acid uptake was exclusive to the non-synaptic PD model. Furthermore, increased flux of the mitochondrial ornithine transaminase reaction (ORNTArm), which converts oxoglutaric acid and ornithine into glutamate-5-semialdehyde and glutamate, was predicted to rescue bioenergetic failure and improve metabolite exchanges for both the synaptic and non-synaptic PD models.
Discussion: The predicted differences in ATP contribution between models highlight the bioenergetic differences between these neuronal components, thereby contributing to the selective vulnerability observed in PD. The observed differences in metabolite exchanges reflect distinct metabolic patterns between these neuronal components. Additionally, mitochondrial ornithine transaminase was predicted to be the potential bioenergetic rescue target for both the synaptic and non-synaptic PD models. Further research is needed to validate these dysfunction mechanisms across different components of dopaminergic neurons and to explore targeted therapeutic strategies for PD patients.
Keywords: Parkinson’s disease; bioenergetics; modeling; non-synaptic; synaptic.
Copyright © 2025 Luo, El Assal, Liu, Ranjbar and Fleming.
Conflict of interest statement
The authors declare that the research was conducted in the absence of any commercial or financial relationships that could be construed as a potential conflict of interest.
Figures


Similar articles
-
Comparison of cellulose, modified cellulose and synthetic membranes in the haemodialysis of patients with end-stage renal disease.Cochrane Database Syst Rev. 2001;(3):CD003234. doi: 10.1002/14651858.CD003234. Cochrane Database Syst Rev. 2001. Update in: Cochrane Database Syst Rev. 2005 Jul 20;(3):CD003234. doi: 10.1002/14651858.CD003234.pub2. PMID: 11687058 Updated.
-
Use of β-adrenoreceptor drugs and Parkinson's disease incidence in women from the French E3N cohort study.J Parkinsons Dis. 2025 Jun;15(4):789-804. doi: 10.1177/1877718X251330993. Epub 2025 Apr 29. J Parkinsons Dis. 2025. PMID: 40302366
-
Topotecan, pegylated liposomal doxorubicin hydrochloride and paclitaxel for second-line or subsequent treatment of advanced ovarian cancer: a systematic review and economic evaluation.Health Technol Assess. 2006 Mar;10(9):1-132. iii-iv. doi: 10.3310/hta10090. Health Technol Assess. 2006. PMID: 16545208
-
Systemic pharmacological treatments for chronic plaque psoriasis: a network meta-analysis.Cochrane Database Syst Rev. 2017 Dec 22;12(12):CD011535. doi: 10.1002/14651858.CD011535.pub2. Cochrane Database Syst Rev. 2017. Update in: Cochrane Database Syst Rev. 2020 Jan 9;1:CD011535. doi: 10.1002/14651858.CD011535.pub3. PMID: 29271481 Free PMC article. Updated.
-
Immunogenicity and seroefficacy of pneumococcal conjugate vaccines: a systematic review and network meta-analysis.Health Technol Assess. 2024 Jul;28(34):1-109. doi: 10.3310/YWHA3079. Health Technol Assess. 2024. PMID: 39046101 Free PMC article.
References
LinkOut - more resources
Full Text Sources