. 2025 Sep;122(9):2592-2608.
doi: 10.1002/bit.29033. Epub 2025 Jun 20.

Assessment of Anticancer Effects of Aloe vera on 3D Liver Tumor Spheroids in a Microfluidic Platform

Affiliations

Assessment of Anticancer Effects of Aloe vera on 3D Liver Tumor Spheroids in a Microfluidic Platform

Atakan Tevlek et al. Biotechnol Bioeng. 2025 Sep.

Abstract

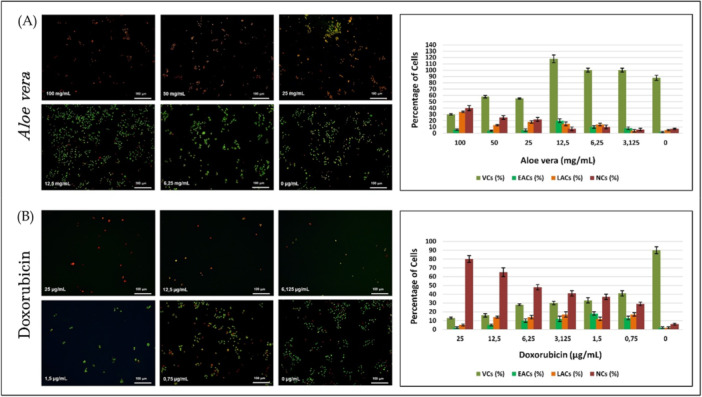
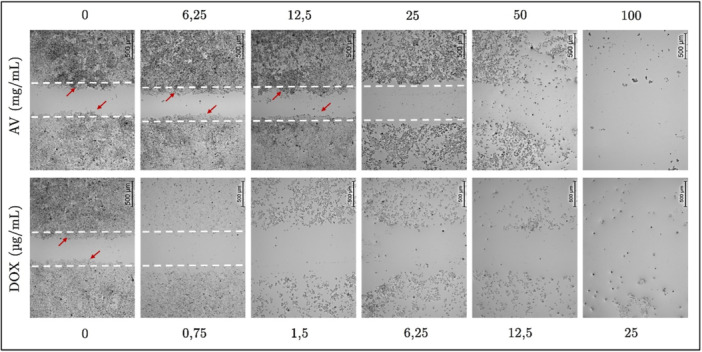
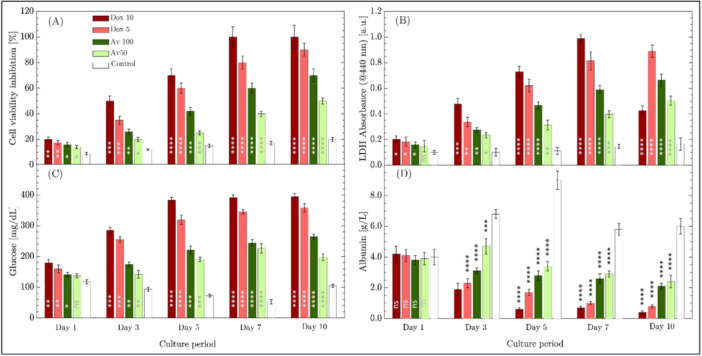
The search for effective anticancer therapies has increasingly focused on natural compounds like Aloe vera, renowned for its therapeutic properties. This study investigates the anticancer properties of Aloe vera on 3D liver tumor spheroids via a PDMS-based microfluidic device, providing a more physiologically realistic model compared to traditional 2D cultures. HepG2 cells were cultivated to generate 3D spheroids on-chip, thereafter subjected to different concentrations of Aloe vera and the chemotherapeutic drug Doxorubicin to evaluate cytotoxic effects. The microfluidic system, validated by COMSOL simulations, facilitated continuous perfusion and real-time assessment of cell viability over a duration of 10 days. The results indicated that Aloe vera markedly diminished cell viability by triggering apoptosis at concentrations over 12.5 mg/mL. IC50 values were determined at 72 h: 25 ± 0.10 mg/mL for Aloe vera and 5.47 ± 0.03 µg/mL for Doxorubicin in 2D cultures, but in 3D cultures, the IC50 values were 31.25 ± 0.14 mg/mL for Aloe vera and 8.33 ± 0.05 µg/mL for Doxorubicin. This study underscores the promise of Aloe vera as a natural anticancer agent and illustrates the efficacy of microfluidic platforms for enhanced drug screening and customized medicine applications.

Keywords: 3D cell culture; Aloe vera; anticancer agent; microfluidic.


Conflict of interest statement

The authors declare no conflicts of interest.

Figures

Figure 1
Figure 1
(A) Teflon master mold and the fabricated PDMS chip, and (B) the sealed chip with PTFE tubings. PDMS, polydimethylsiloxane.
Figure 2
Figure 2
COMSOL multiphysics simulation showing the velocity profile and flow field distribution inside the microfluidic device. The color scale indicates fluid velocity from 0 mm/s (blue) to 0.30 mm/s (red). The flow enters from the left inlet and exits through the right outlet, maintaining a smooth laminar profile along the straight channel. The magnified view of the truncated cone section at the midplane highlights the controlled decrease in velocity, minimizing shear stress in the 3D cell culture wells.
Figure 3
Figure 3
Schematic representation of the experimental design for two‐dimensional (2D) and three‐dimensional (3D) cell culture studies. LDH, lactate dehydrogenase; MTT, 3‐(4,5‐dimethyl‐2‐thiazolyl)‐2,5‐diphenyl‐2H‐tetrazolium bromide.
Figure 4
Figure 4
Cytotoxicity of Aloe vera (A) and Doxorubicin (B) on HepG2 cells in 2D and 3D cultures over 24, 48, and 72 h. Bar graphs represent cell viability percentages across a range of concentrations to illustrate dose‐ and time‐dependent responses. Each bar indicates the mean ± standard deviation of five replicates (n = 5). Statistical significance within each culture model (2D or 3D) was assessed using repeated‐measures two‐way ANOVA followed by Tukey's multiple comparisons test. Comparisons were made between each treatment group and the corresponding control (C1) at each time point. Asterisks above individual bars denote significant differences versus the control group (C1): *p < 0.05, **p < 0.01, ***p < 0.001, ****p < 0.0001; ns = not significant. 2D vs. 3D comparisons at the same concentration and time point were performed separately and are reported in Section 3 to avoid visual overcrowding in the figure.
Figure 5
Figure 5
Fluorescence‐based assessment of apoptosis and necrosis in HepG2 cells treated with Aloe vera and Doxorubicin for 72 h. (A) Shows fluorescence microscopy images and corresponding quantitative analysis of cells exposed to increasing concentrations of Aloe vera (0, 3.125, 6.25, 12.5, 25, 50, and 100 mg/mL). (B) Presents equivalent data for Doxorubicin‐treated cells (0, 0.75, 1.5, 3.125, 6.125, 12.5, and 25 µg/mL). Green fluorescence indicates viable cells (AO‐positive, PI‐negative), early apoptotic cells appear green with nuclear condensation, late apoptotic cells exhibit orange/red fluorescence with nuclear fragmentation, and necrotic cells display intense red staining. The bar graphs reflect the percentages of viable cells (VC), early apoptotic cells (EAC), late apoptotic cells (LAC), and necrotic cells (NC) for each treatment condition. Data are presented as mean ± standard deviation (n = 5).
Figure 6
Figure 6
Representative wound healing assay images illustrating the migratory capacity of HepG2 cells after 24 h of treatment with Aloe vera or Doxorubicin. The upper row displays Doxorubicin‐treated groups (0, 0.75, 1.5, 3.125, 6.25, 12.5, and 25 µg/mL), while the lower row shows Aloe vera‐treated groups (0, 3.125, 6.25, 12.5, 25, 50, and 100 mg/mL). A confluent monolayer was scratched at baseline (0 h), and cell migration into the wound area was assessed at 24 h. The white dashed lines indicate the initial wound boundaries, and red arrows highlight the leading edge of migrating cells.
Figure 7
Figure 7
Light microscopy images of spheroids were formed using the conventional hanging drop technique, and spheroids were generated within polydimethylsiloxane (PDMS) microfluidic chips on different culture days.
Figure 8
Figure 8
Apoptosis and necrosis assessment of three‐dimensional (3D) spheroids treated with Aloe vera (50 mg/mL and 100 mg/mL) and Doxorubicin (5 µg/mL and 10 µg/mL) inside a polydimethylsiloxane (PDMS)‐based microfluidic chip. Spheroids were stained using acridine orange (AO)/propidium iodide (PI) double staining to evaluate cell viability, apoptosis, and necrosis. Green fluorescence represents viable cells, orange indicates early/late apoptotic cells, and red denotes necrotic cells. In the Aloe vera 100 mg/mL group, which represents a supra‐IC50 concentration, a gradual decrease in spheroid size and increased apoptosis and necrosis were observed qualitatively. In the Doxorubicin 10 µg/mL group, also a supra‐IC50 dose, necrosis became predominant, with almost no cells remaining by Day 5. The results demonstrate the dose‐dependent effects of both agents in a 3D culture system, with distinct apoptotic and necrotic pathways triggered at supra‐IC50 concentrations. Red scale bars indicate 500 µm and serve as a visual reference for spheroid size across all groups and time points.
Figure 9
Figure 9
Evaluation of cellular responses in 3D spheroids treated with different concentrations of Doxorubicin (Dox 10, Dox 5) and Aloe vera (AV 100, AV 50) over a 10‐day culture period. (A) Cell viability inhibition measured via Alamar Blue assay, showing significant reductions in viability across treatment groups compared to control, with Doxorubicin causing a more rapid and pronounced inhibition. (B) LDH release into the culture medium as an indicator of membrane damage, with Doxorubicin causing a significant increase in LDH levels, indicative of necrosis, while Aloe vera induced a more gradual release, consistent with apoptotic cell death. (C) Remaining glucose levels in the culture medium, highlighting reduced glucose consumption in the Doxorubicin‐treated spheroids due to cell death, while Aloe vera‐treated spheroids showed a delayed but progressive reduction in glucose consumption. (D) Albumin secretion as a measure of liver function, with Doxorubicin causing a rapid decline in albumin production, and Aloe vera exerting a more gradual inhibitory effect on metabolic activity. Data are presented as mean ± standard deviation (n = 3). Statistical significance shown was evaluated using one‐way ANOVA followed by Tukey's post hoc test. Significant differences compared to the control group at each time point are indicated as follows: *p < 0.05, **p < 0.01, ***p < 0.001, **p < 0.0001, and ns = not significant. ANOVA, analysis of variance; LDH, lactate dehydrogenase.

Similar articles

References

    1. Algarni, A. A. 2021. “Cytotoxic Activity of Ethanolic Extract of Aloe Saudiarabica and Aloe Shadensis Against Three Human Cancer Cell Line.” Journal of Pharmaceutical Research International 1: 138–146.
    1. Andrea, B. , Dumitrița R., Florina C., et al. 2020. “Comparative Analysis of Some Bioactive Compounds in Leaves of Different Aloe Species.” BMC Chemistry 14: 67. 10.1186/s13065-020-00720-3. - DOI - PMC - PubMed
    1. Ashutosh Kumar Yadav, Y. , Abhishek Yadav Y., Manish Yadav Y., Md Akhlak A., Shweta Mishra M., and Jitendra Kumar Rai R.. 2023. “A Review on Drug Stability.” International Journal of Science and Research Archive 9: 474–485.
    1. Bagherian, T. , Tackallou S. H., and Mohammadgholi A.. 2021. “Quantitative Measurement of Bax and Bcl2 Genes and Protein Expression in MCF7 Cell‐Line When Treated by Aloe vera Extract.” Gene Reports 23: 101123. https://www.sciencedirect.com/science/article/pii/S2452014421001084.
    1. Bakshi, H. A. , Mkhael M., Faruck H. L., et al. 2024. “Cellular Signaling In the Hypoxic Cancer Microenvironment: Implications for Drug Resistance and Therapeutic Targeting.” Cellular Signalling 113: 110911. https://www.sciencedirect.com/science/article/pii/S0898656823003261. - PubMed

LinkOut - more resources