. 2025 Sep;12(33):e05659.
doi: 10.1002/advs.202505659. Epub 2025 Jun 20.

BRD4 Signaling Maintains the Differentiated State of β Cells

Affiliations

BRD4 Signaling Maintains the Differentiated State of β Cells

Fuqiang Liu et al. Adv Sci (Weinh). 2025 Sep.

Abstract

In diabetes, pancreatic β cells degenerate from their mature differentiated state to a dedifferentiated state. BRD4 plays a pivotal role during embryogenesis and cancer development, but its function in modulating β-cell differentiation remains unknown. In this study, multiple models including calorie restriction db/db mouse, long-term and acute conditional knockout mouse, and human islet organoids are adopted to assess BRD4 function in β cells. Two hundred twenty-two young patients with diabetes are also recruited for whole exome sequencing (WES) to screen for BRD4 mutations. This study shows that BRD4 expression is significantly reduced in human diabetic β cells while significantly increased after calorie restriction in the diabetic mouse. β cell differentiation is impaired after long-term and acute Brd4 knockout. BRD4 knockdown in human islet organoids results in the loss of differentiation and reduction of insulin synthesis. It is found that p.R749C can significantly affect BRD4 signaling and might play roles in diabetes development in patients. This study also shows that ATF5 is a direct target of the BRD4 pathway in β cells. Targeting BRD4-mediated regulatory networks may hold promise for developing novel therapeutic strategies to maintain the differentiated state of β cells.

Keywords: ATF5; BRD4; diabetes; differentiation; β cell.


Conflict of interest statement

The authors declare no conflict of interest.

Figures

Figure 1
Figure 1
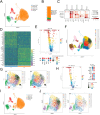
Brd4 expression is correlated with the differentiation and function of β cells in a caloric restriction mouse model. Male db/db mice were treated with ≈50% (R4, n = 5) or ≈75% (R2, n = 5) dietary restriction, and body weights were plotted for up to 29 days in the different groups (A). Random blood glucose levels were monitored in the different groups (B). Plasma insulin levels were measured via the glucose tolerance test (IPGTT) (C). Uniform manifold approximation and projection (UMAP) representation of islet cells from db/db, db/m, R4 and R2 mice (D). Reclustering of epithelial cells into acinar cells, beta cells, alpha cells, delta cells, PP cells, pancreatic ductal cells, and neuron cells; each dot corresponds to a single cell (E). UMAP analysis of sample types of origin (F). Bubble diagram illustrating the expression of Slc2a2, Ins1, Mafa, Nkx6‐1, Ucn3, Glp1r, Pdx1, Pax6, Nkx2‐2, Isl1 and Gck in db/db, db/m, R4 and R2 β cells. The color depth and size of each bubble are positively correlated with gene expression (G). Volcano plot showing Ccnd2 expression in db/db, db/m, R4 and R2 β cells (H). Volcano plot demonstrating Brd4 expression in db/db, db/m, R4 and R2 β cells (I). Bubble diagram illustrating Brd4 expression in db/db, db/m, R4 and R2 β cells. The color depth and size of each bubble are positively correlated with Brd4 expression (J). Reclustering of β cells into 13 subtypes represented by a UMAP plot. The arrow shows subtype 8 cells in db/db, db/m, R4 and R2 mice (K). Volcano plot (L) and bubble diagram (M) illustrating the expression of Slc2a2, Ins1, Ins2, Mafa, Nkx6‐1, Ucn3, Glp1r and Pdx1 in subtype 8 and other β cells. Volcano plot showing Ccnd2 expression in subtype 8 and other β cells (N). Bubble diagram illustrating Brd4 expression in subtype 8 and other β cells. The color depth and size of each bubble are positively correlated with Brd4 expression (O). Representative images of immunofluorescence staining for Brd4 (green) and insulin (red) in db/db, db/m, R4 and R2 islets (P). *, R4 vs db/db; #, R2 vs db/db; $, R4 vs db/m. *, # or $, p < 0.05; ** or ##, p < 0.01; *** or ###, p < 0.001.
Figure 2
Figure 2
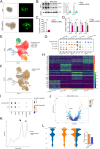
BRD4 expression is reduced in prediabetic (Pre_T2D) and T2D β cells and Brd4 knockout results in impaired β cell function. UMAP analysis of samples from nondiabetic, Pre_T2D and T2D (Type 2 diabetes) islets are colored by cell type (A), including acinar cells, beta cells (β cells), alpha cells, delta cells, PP cells, pancreatic ductal cells, ECS, stromal cells and immune cells, and stained by group source (B). Bubble diagram illustrates BRD4 expression in Pre_T2D, nondiabetic and T2D β cells. The color depth and size of each bubble are positively correlated with BRD4 expression (C). Volcano plot depicting BRD4 expression in Pre_T2D, nondiabetic and T2D β cells. The data are colored according to expression level, and the legend is labeled on a log scale (D). Schematic diagram of the Brd4 ‐/‐ mouse model construction and treatment process. RIP‐Cre +/Brd4 flox/flox (RBKO) or Pdx1‐CreER +/Brd4 flox/flox (PBKO) mice were generated using the Cre‐LoxP recombination system. Exons 6 and 7 are deleted upon Brd4Cre‐mediated recombination (E). Representative immunofluorescence (IF) images of Brd4 (green) and insulin (red) in pancreatic islets from control and RBKO mice. The arrow shows Brd4 knockout β cells (n = 7, F). qPCR analysis of Brd4 gene expression in control and RBKO mice (n = 3, G). Plasma glucose levels were measured in randomly selected control and RBKO mice at 4, 8, and 16 weeks (n = 6, H). The results of the intraperitoneal glucose tolerance test (IPGTT) of the control and RBKO mice (I). Plasma insulin levels during the IPGTT in the control and RBKO mice (J). Glucose‐stimulated insulin secretion (GSIS) experiments revealed effects of low (2.8 mm), moderate (11.1 mm) and high (25 mm) glucose concentrations on insulin secretion (µg/total insulin) in the islets of control and RBKO mice (n = 6, K). Schematic model of tamoxifen‐induced Cre‐dependent deletion of the conditional Brd4 alleles in the Pdx1‐CreER/Brd4 flox/flox (PBKO) mice (L). Plasma glucose levels were randomly measured in control and RBKO mice at 6 and 8 weeks of age (n = 6, M). Fasting and refed blood glucose levels in control and RBKO mice (n = 7, N). Plasma insulin levels were measured in control and PBKO mice (n = 5, O). GSIS experiments revealed effects of low (2.8 mm), moderate (11.1 mm) and high (25 mm) glucose concentrations on insulin secretion (µg/total insulin) in the islets of control and PBKO mice (n = 3, P). The values are expressed as the means ± SEM. *p < 0.05; **p < 0.01; ***p < 0.001. Scale bar = 20 µm.
Figure 3
Figure 3
Brd4 deletion impairs β‐cell differentiation and proliferation. Representative IF images depicting Gcg (red) and DAPI (blue) staining in pancreatic islets from RBKO, PBKO, and control mice (n = 8, A). Representative IF images depicting Ki67 (green), insulin (red), and DAPI (blue) staining in pancreatic islets from RBKO, PBKO, and control mice (n = 4, B). Quantitative analysis of the percentages (%) of Gcg‐positive cells and Ki67‐positive cells revealed by IF analysis of Figure A,B (C). Representative IF images depicting Glut2 (green, D), Mafa (green, E), proinsulin (green, F), and insulin (red), and DAPI (blue), in pancreatic islets from control, RBKO and PBKO mice. PBKO, Pdx1‐CreER;Brd4 flox/flox. RBKO, RIP‐Cre;Brd4 flox/flox. *p < 0.05. Gcg, Glucagon. Scale bar = 20 µm.
Figure 4
Figure 4
ScRNA‐seq revealed dynamic cellular subtypes and gene expression changes in Brd4‐deficient β cells. UMAP analysis of islets from 8‐week‐old control (C8) and PBKO (K8) mice stratified by cell type, including acinar cells, beta cells (β cells), alpha cells, delta cells, and PP cells; each dot corresponds to a single cell (A). The mean proportion of each cell subtype is presented for the C8 and K8 groups (B). Bubble chart showing the expression of the top marker genes in each cell cluster (C). Heatmap of the top 20 significant DEGs whose expression increased or decreased in the C8 and K8 β cells. The data are colored according to expression level, and the legend is labeled on a log scale (D). Volcano plot and bubble diagram depicting significant DEGs related to β‐cell differentiation and function between K8 and C8. The data are colored according to expression level, and the legend is labeled on a log scale (E). Reclustering of islet cells into 21 subtypes represented by a UMAP plot (F). β‐cell subtypes identified in the UMAP plot for C8 and K8. The arrow shows the changes in subtypes between C8 and K8 β cells (G). Volcano plot and bubble diagram depicting significant DEGs related to β‐cell maturation and differentiation between subtype 1 of K8 (K8_1) and subtype 8 of C8 (C8_8) β cells. The data are colored according to expression level, and the legend is labeled on a log scale (H). UMAP dimension‐reduction projection analysis of islets from control (C6) and PBKO (K6) mice at 6 weeks of age by cell type, including acinar cells, beta cells (β cells), alpha cells, delta cells, and PP cells; each dot corresponds to a single cell (I). β cell subtypes identified in the UMAP plot with C6 and K6 (J). PBKO, Pdx1‐CreER;Brd4 flox/flox.
Figure 5
Figure 5
ScATAC‐seq revealed that chromatin accessibility was altered in Brd4‐deficient β cells. Analysis of chromatin accessibility patterns within transcription factor start sites (TFSSs) revealed the distinct grouping of islet cells into PanSCs, MCs, ECs, and epithelial cells, and each dot corresponds to a single cell (A). Clustering of distinct epithelial cells, including alpha cells, beta cells (β cells), acinar cells, and delta cells, based on chromatin accessibility patterns within the TFSS (B). Heatmap of annotated characteristic peaks for chromatin accessibility in different cell types (C). UMAP visualizations of control and PBKO islet cells based on chromatin accessibility patterns within the TFSS (D). Proportion of PBKO and control epithelial cells (E). Bar plot of the annotated differential peaks for chromatin accessibility between PBKO and control β cells; the main difference was located in the promoter region (F). Heatmap of the top 20 DEGs in PBKO and control β cells according to the scATAC gene score (see Experimental Section) (G). GO enrichment analysis of DEGs based on the scATAC gene score (H). Heatmap of the top differentially expressed transcription factors in PBKO and control β cells based on transcription factor activity analysis (see Experimental Section) (I). IGV visualization of peaks representing chromatin accessibility in the Ttc4 and Mafa promoter regions in PBKO and control β cells (J). Con, control. PanSCs, pancreatic stellate cells. MCs, mesothelial cells. ECs, endothelial cells. PBKO, Pdx1‐CreER;Brd4 flox/flox.
Figure 6
Figure 6
BRD4 knockdown impair β cell function in human islet organoids. Representative images showed the infection of BRD4‐shRNA lentivirus in human islet organoids. GFP expression was driven by a CMV promoter and used to track the infection efficiency (green) (A). BRD4 knockdown was validated by western blotting. Both BRD4L (long isoform) and BRD4S (short isoform) can be detected, and GAPDH was used as an internal control (n = 3, B). C‐peptide in whole islet organoids was measured by ELISA, and normalized by total protein (n = 3, C). qPCR showed mRNA level of CHGA, INS, PDX1 and PAX6 after BRD4 knockdown in whole islet organoids (n = 4, D). UMAP analysis of cells from control (Con) and BRD4‐knockdown islet organoids stratified by cell type, including human pluripotent stem cell‐derived (SC) β cells, progenitor cells, SC α cells and SC EC (enterochromaffin) cells; each dot corresponds to a single cell (E). UMAP visualization of the single‐cell transcriptomic dataset of islet organoids cells. Different colors represent different samples (F). Violin plot of cell type marker genes that identified the clusters generated by UMAP plotting (G). Heatmap of the top 20 significant DEGs in different cell type (H). Bubble diagram illustrating the expression of INS, CHGA, CHGB, PAX4, NEUROD1, and BRD4 in control and BRD4‐knockdown SC β cells. The color depth and size of each bubble are positively correlated with gene expression (I). Volcano plot showing INS, CHGA, CHGB, PAX4, NEUROD1, and BRD4 in control and BRD4‐knockdown SC β cells (J). Single‐cell trajectory analysis with Monocle 2 identifies two density peaks during SC β cells differentiation, and BRD4 knockdown can affect the peak height; Different density peaks were marked by arrows with different colors (K). Monocle trajectory analysis showing the change of stream density in control and BRD4‐knockdown SC β cells; Density ratio = a/b (L). *p < 0.05; ***p < 0.001.
Figure 7
Figure 7
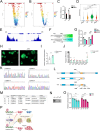
ATF5 is a target of the BRD4 pathway, and the p.R749C mutation can affect BRD4‐ATF5 signaling. Volcano plot depicting Atf4/Atf5 changes between K8 and C8 β cells. The data are colored according to expression level, and the legend is labeled on a logarithmic scale (A). Volcano plot depicting significant changes in Atf4/Atf5 expression between K8_1‐subtype and C8_8‐subtype β cells (B). qPCR analysis of Atf4 and Atf5 gene expression in the islets of control and RBKO mice (n = 3, C). Volcano plot depicting significant changes in Atf5 expression in db/db, db/m, R4 and R2 β cells (D). IGV visualization of Brd4 binding peaks at the promoter regions of Atf4 and Atf5 in INS1 cells based on ChIP‐seq data (E). A schematic diagram of the ATF4 and ATF5 luciferase reporters (F). ATF4 and ATF5 expression can be regulated by BRD4L and BRD4S, as indicated by luciferase assays. Firefly luciferase activities were normalized to Renilla luciferase activities (n = 7, G). Representative images showed RBKO islets were transduced by control (empty vector, GFP only) and ATF5 (ATF5‐P2A‐GFP) lentivirus. Green is GFP signal (H). Insulin content were measured after ATF5 overexpression in RBKO islets (n = 6, I). qPCR analysis of Ins1, Ins2, Mafa, Pdx1, Chga and ATF5 expression in the RBKO islets after ATF5 overexpression (n = 4, J). BRD4 mutations were validated by Sanger sequencing (K). Mutations were mapped to different transcript variants of BRD4, and different functional domains are colored (L). The table shows basic information about BRD4 mutations and functional prediction (M). PCR detection of different BRD4 transcript variants in human islets (N). The impact of mutations on the BRD4‐ATF4/ATF5 pathway indicated by a luciferase assay. Firefly luciferase activities were normalized to Renilla luciferase activities (n = 8, O). A schematic diagram of the BRD4‐ATF5 pathway and the different effects caused by long‐term and acute BRD4 deletion in β cells (P). The values are expressed as the means ± SEM. *p < 0.05; **p < 0.01; ***p < 0.001. Con, control. BRD4L, long isoform of BRD4. BRD4S, short isoform of BRD4. TVL, transcript variant for long BRD4. TVS, transcript variant for short BRD4. TV3, BRD4 transcript variant 3. SIFT, Sorting Intolerant From Tolerant. GERP, genomic evolutionary rate profiling. ACMG, the American College of Medical Genetics and Genomics. RBKO, RIP‐Cre; Brd4 flox/flox.

References

    1. Vetere A., Choudhary A., Burns S. M., Wagner B. K., Nat. Rev. Drug Discovery 2014, 13, 278. - PubMed
    1. Accili D., Talchai S. C., Kim‐Muller J. Y., Cinti F., Ishida E., Ordelheide A. M., Kuo T., Fan J., Son J., Diabetes Obes. Metab. 2016, 18, 117. - PMC - PubMed
    1. Donati B., Lorenzini E., Mol. Cancer 2018, 17, 164. - PMC - PubMed
    1. Roe J.‐S., Mercan F., Rivera K., Pappin D. J., Vakoc C. R., Mol. Cell 2015, 58, 1028. - PMC - PubMed
    1. Shi J., Wang Y., Zeng L., Wu Y., Deng J., Zhang Q., Lin Y., Li J., Kang T., Tao M., Rusinova E., Zhang G., Wang C., Zhu H., Yao J., Zeng Y.‐X., Mark Evers B., Zhou M.‐M., Zhou B. P., Cancer Cell 2014, 25, 210. - PMC - PubMed

LinkOut - more resources