. 2025 Sep;12(34):e04526.
doi: 10.1002/advs.202504526. Epub 2025 Jun 20.

Intestinal Clock Promotes Cognitive Memory Through Adenosine Signaling

Affiliations

Intestinal Clock Promotes Cognitive Memory Through Adenosine Signaling

Min Chen et al. Adv Sci (Weinh). 2025 Sep.

Abstract

Although the intestinal clock (the circadian timing system in the gastrointestinal tract) is known to direct a wide variety of diurnal nutrients and metabolites, its role in the functioning of extra-intestinal tissues such as the brain remains elusive. Here the role of the intestinal clock in shaping cognitive function is investigated. It is found that Bmal1-iKO mice (mice with Bmal1 [Brain and muscle Arnt-like protein 1] specifically knocked out in the intestine, a mouse line deficient in intestinal clock function) show a defect in cognitive memory irrespective of the time-of-day. Bmal1-iKO-associated cognitive decline is attributed to impaired adenosine signaling and compromised long-term potentiation (LTP) in the hippocampus. Adenosine signaling promotes LTP via enhancing BDNF expression and inhibiting synapse loss. Furthermore, the impairment in adenosine signaling is accounted for by the reductions in intestinal absorption of and hippocampal level of adenosine but not by a change in adenosine receptors. Consistently, adenosine supplementation rescues cognitive deficits associated with the malfunction of the intestinal clock. Moreover, BMAL1 regulates the expression of ADK (adenosine kinase, a primary enzyme for adenosine clearance) in the small intestine and thus promotes intestinal adenosine absorption through REV-ERBα which binds directly to Adk P2 promoter to inhibit its transcription. Together, an unsuspected role of the intestinal clock in controlling cognitive memory is identified, highlighting the intestinal clock as a promising target for the management of cognitive disorders.

Keywords: adenosine; circadian rhythm; cognitive memory; intestinal clock.


Conflict of interest statement

The authors declare no conflict of interest.

Figures
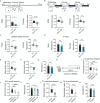
Figure 1
Figure 1
Malfunction of the intestinal clock causes cognitive deficits in mice. A) Diagram of the experimental design for assessing short‐term memory (top). Discrimination index in NOR test during 2 h retention session in male and female Bmal1‐iKO and control mice (n = 7–10, bottom). B) Diagram of the experimental design for assessing long‐term memory (top). Discrimination index in NOR during 24 h recall session in male and female Bmal1‐iKO and control mice (n = 8–10, bottom). C) Performance on SOL test in male and female Bmal1‐iKO and control mice (n = 7–10). D) Spontaneous alternations in Y maze test in male and female Bmal1‐iKO and control mice (n = 7–10). E) Discrimination index in NOR test during 2 h retention session in Bmal1‐iKO and control mice (n = 7–8) at an age of 23–27 days. F) Discrimination index in NOR test during 24 h recall session in Bmal1‐iKO and control mice (n = 7) at an age of 23–27 days. G) Spontaneous alternations in Y maze test in Bmal1‐iKO and control mice (n = 8) at an age of 23–27 days. H) Timeline schematic for SR9009 treatment and behavioral tests. I) Discrimination index in NOR test during 2 h retention session in male SR9009‐ and vehicle‐treated mice (n = 7–8). J) Discrimination index in NOR test during 24 h recall session in male SR9009‐ and vehicle‐treated mice (n = 8). K) Spontaneous alternations in Y maze test in male SR9009‐ and vehicle‐treated mice (n = 8). L) Discrimination index in NOR test during 2 h retention session in female SR9009 (100 mg kg−1)‐ and vehicle‐treated mice (n = 7–8). M) Discrimination index in NOR test during 24 h recall session in female SR9009 (100 mg kg−1)‐ and vehicle‐treated mice (n = 7–8). N) Spontaneous alternations in Y maze test in female SR9009 (100 mg kg−1)‐ and vehicle‐treated mice (n = 8). Discrimination indices were calculated as: (Time for novel object exploring – time for familiar object exploring)/(Time for novel object exploring + time for familiar object exploring). All behavioral tests were conducted at ZT6. Data are mean ± SEM, and analyzed by two‐tailed Student's t‐test (A–G and L–N), and one‐way ANOVA followed by Bonferroni posttest (I–K). * p  <  0.05, ** p  <  0.01, *** p < 0.001 and **** p < 0.0001.
Figure 2
Figure 2
Loss of intestinal Bmal1 impairs hippocampal LTP in mice. A) Heatmap for differentially expressed genes (DEGs) in the hippocampus caused by Bmal1‐iKO (n = 3). B) Volcano plot showing differential gene expression. C) GO enrichment analysis of hippocampal DEGs associated with Bmal1‐iKO. D, qPCR analyses of synaptic plasticity‐related genes in the hippocampus from Bmal1‐iKO and control mice at different time points (n = 6). E) Schematic illustration of the experimental configuration for LTP. The Schaffer collateral pathway (SC, red) was stimulated, and field potentials were recorded in the CA1 region of the hippocampus. LTP was induced by theta‐burst stimulation (TBS). DG, dentate gyrus; CA, cornu ammonis. F) Input/output curves in hippocampal slices from Bmal1‐iKO and control mice at ZT18 (n = 6). G) Paired‐pulse facilitation in hippocampal slices from Bmal1‐iKO and control mice at ZT18 (n = 6). H) Time course of fEPSP recordings in hippocampal slices from Bmal1‐iKO and control mice after TBS at ZT18‐20 (n = 4). I) Average normalized fEPSP slope for hippocampal slices from Bmal1‐iKO and control mice at different time intervals (n = 3–4). J) Time course of fEPSP recordings in hippocampal slices from Bmal1‐iKO and control mice after a low‐frequency stimulation (LFS) at ZT18‐20 (n = 3). In panel (I) fEPSP slopes were normalized to the 20 min baseline average (pre‐TBS). All data are mean ± SEM, and analyzed by two‐way ANOVA followed by Bonferroni posttest (D,I). * p  <  0.05, ** p  <  0.01, *** p < 0.001 and **** p < 0.0001.
Figure 3
Figure 3
Involvement of adenosine‐A1R signaling in intestinal clock regulation of cognition. A) KEGG pathway analysis of differential metabolites in the small intestine from Bmal1‐iKO and control mice at ZT6 according to metabolomic experiments (n = 3). B) Peak areas of adenosine, fumarate, and nicotinate in the small intestine from Bmal1‐iKO and control mice at ZT6 (n = 3). C, Adenosine, fumarate, and nicotinate concentrations in the small intestine from Bmal1‐iKO and control mice based on LC‐MS/MS with multiple reaction monitoring (n = 6). D) Adenosine concentrations in the blood and hippocampus from Bmal1‐iKO and control mice based on LC‐MS/MS with multiple reaction monitoring (n = 6). E) Expression of adenosine receptors (Adora1, Adora2a, Adora2b, and Adora3) in the hippocampus from Bmal1‐iKO and control mice according to RNA‐seq (n = 3). F) Immunoblotting of hippocampal enzymes involved in adenosine‐A1R signaling in Bmal1‐iKO and control mice. For western blotting analysis of diurnal protein expression, three of nine samples from nine mice at each time point were pooled to generate three biological replicates. One representative blot is shown from three biological replicates. G) Representative Golgi‐stained CA1 pyramidal neurons, showing decreased total dendrite length in Bmal1‐iKO mice. H) Neurite arborization of CA1 pyramidal neurons in Bmal1‐iKO and control mice (n = 6). I) Representative images of dendritic branches from Golgi‐stained CA1 pyramidal neurons (scale bar, 10 µm). J) Spine density of the dendrites of CA1 pyramidal neurons in Bmal1‐iKO and control mice (n = 8). Mice were sacrificed and the samples were collected at ZT6. Data are mean ± SEM, and analyzed by two‐tailed Student's t‐test (B,J), and two‐way ANOVA followed by Bonferroni posttest (C,D). * p  <  0.05, ** p  <  0.01, *** p < 0.001 and **** p < 0.0001.
Figure 4
Figure 4
Adenosine‐A1R signaling enhancement rescues Bmal1‐iKO‐induced cognitive impairments. A) Adenosine levels in the small intestine, blood, and hippocampus from Bmal1‐iKO mice gavaged with adenosine or vehicle (n = 6). B) Immunoblotting of hippocampal enzymes involved in adenosine‐A1R signaling in Bmal1‐iKO mice gavaged with adenosine or vehicle. Three of nine samples from nine mice were pooled to generate three biological replicates. C) Representative Golgi‐stained CA1 pyramidal neurons, showing increased total dendrite length in Bmal1‐iKO mice gavaged with adenosine. D) Neurite arborization of CA1 pyramidal neurons in Bmal1‐iKO mice gavaged with adenosine or vehicle (n = 6). E) Representative images of dendritic branches from Golgi‐stained CA1 pyramidal neurons (scale bar, 10 µm). F) Spine density of the dendrites of CA1 pyramidal neurons in Bmal1‐iKO mice gavaged with adenosine or vehicle (n = 6). G) Discrimination index in NOR test during 2 h retention session in Bmal1‐iKO mice gavaged with adenosine or vehicle (n = 7). H) Spontaneous alternations in Y maze test in Bmal1‐iKO mice gavaged with adenosine or vehicle (n = 8). I) Discrimination index in NOR test during 2 h retention session in Bmal1‐iKO mice treated with CCPA or vehicle (n = 7). J) Spontaneous alternations in Y maze test in Bmal1‐iKO mice treated with CCPA or vehicle (n = 7). K) Discrimination index in NOR test during 2 h retention session in Bmal1‐iKO mice treated with NECA or vehicle (n = 7). L) Spontaneous alternations in Y maze test in Bmal1‐iKO mice treated with NECA or vehicle (n = 7). M) Input/output curves in hippocampal slices from Bmal1‐iKO mice treated with CCPA (n = 4) or vehicle (n = 3). N) Paired‐pulse facilitation in hippocampal slices from Bmal1‐iKO mice treated with CCPA (n = 4) or vehicle (n = 3). O) Time course of fEPSP recordings in hippocampal slices from Bmal1‐iKO mice treated with CCPA (n = 4) or vehicle (n = 3). For panels (J,L), the pairing of datapoints represent the same mice tested first vehicle and then CCPA or NECA. Discrimination indices were calculated as: (Time for novel object exploring – time for familiar object exploring)/(Time for novel object exploring + time for familiar object exploring). All behavioral tests were conducted at ZT6. Mice were sacrificed and the samples were collected at ZT6. Data are mean ± SEM, and analyzed by two‐way ANOVA followed by Bonferroni posttest (A,G, and H) and two‐tailed Student's t‐test (F,I, and J). *p  <  0.05, ** p  <  0.01, *** p < 0.001 and **** p < 0.0001.
Figure 5
Figure 5
Intestinal Bmal1 regulates adenosine absorption via adenosine kinase (ADK). A) A diagram for intestinal disposition and absorption of adenosine. B) Relative expression of intestinal Adk‐S mRNA and ADK protein in Bmal1‐iKO and control mice (n = 6). For western blotting analysis of diurnal protein expression, three of nine samples from nine mice at each time point were pooled to generate three biological replicates. One representative blot is shown from three biological replicates. C) ADK activities were measured using intestinal S9 fraction (prepared from Bmal1‐iKO and Bmal1‐flox mice) and siBmal1‐ or siNC‐treated CT26 cells (n = 6). D) Adenosine levels in the portal vein blood from Bmal1‐iKO and control mice (n = 6). E) Adenosine levels in the intestinal content plus feces from Bmal1‐iKO and control mice (n = 6). F) Immunoblotting of ADK in the small intestine from mice after injection of AAV‐ADK or AAV‐shADK or control. Three of nine samples from nine mice were pooled to generate three biological replicates. G) Adenosine levels in the small intestine, blood, and hippocampus from wild‐type mice after injection of AAV‐ADK and control virus (n = 6). H) Input/output curves in hippocampal slices from wild‐type mice after injection of AAV‐ADK and control virus (n = 4). I) Paired‐pulse facilitation in hippocampal slices from wild‐type mice after injection of AAV‐ADK and control virus (n = 4). J) Time course of fEPSP recordings in hippocampal slices from wild‐type mice after injection of AAV‐ADK and control virus (n = 4). K) Discrimination index in NOR test during 2 h retention session in wild‐type mice after injection of AAV‐ADK and control virus (n = 8). L) Discrimination index in NOR test during 24 h recall session in wild‐type mice after injection of AAV‐ADK and control virus (n = 8). M) Spontaneous alternations in Y maze test in wild‐type mice after injection of AAV‐ADK and control virus (n = 8). N) Adenosine levels in the small intestine, blood, and hippocampus from Bmal1‐iKO mice after injection of AAV‐shADK and control virus (n = 6). O) Discrimination index in NOR test during 2 h retention session in Bmal1‐iKO mice after injection of AAV‐shADK and control virus (n = 6–8). P) Discrimination index in NOR test during 24 h recall session in Bmal1‐iKO mice after injection of AAV‐shADK and control virus (n = 8). Q) Spontaneous alternations in Y maze test in Bmal1‐iKO mice after injection of AAV‐shADK and control virus (n = 8). Discrimination indices were calculated as: (Time for novel object exploring – time for familiar object exploring)/(Time for novel object exploring + time for familiar object exploring). For data in panels (K–M and O–Q), all behavioral tests were conducted at ZT6. For data in panels (G–J and N), the samples were collected at ZT6. Data are mean ± SEM, and analyzed by two‐way ANOVA followed by Bonferroni posttest (B and N–Q) and two‐tailed Student's t‐test (C–E, G, and K–M). * p  <  0.05, ** p  <  0.01, *** p < 0.001 and **** p < 0.0001. ADA, adenosine deaminase; AK1, adenylate kinase‐1; CNT, concentrative nucleoside transporter; ENT, equilibrative nucleoside transporter; NDPK, nucleotide diphosphokinase; NC, negative control.
Figure 6
Figure 6
Intestinal Bmal1 negatively regulates ADK through REV‐ERBɑ. A) Schematic presentation of the transcription factor binding sites in the Adk‐S promoter obtained from the JASPAR database. B) Effects of Rev‐erbɑ overexpression on ADK expression (n = 6). C) Effects of E4bp4 overexpression on ADK expression (n = 6). D) Effects of Dec2 overexpression on ADK expression (n = 6). E) Effects of Rev‐erbɑ knockdown on ADK expression (n = 6). F) Relative expression of intestinal Adk‐S mRNA and ADK protein in Rev‐erbɑ‐iKO and control mice (n = 6). For western blotting analysis of diurnal protein expression, three of nine samples from nine mice at each time point were pooled to generate three biological replicates. One representative blot is shown from three biological replicates. G) Luciferase reporter assays showing dose‐dependent inhibition of Adk‐S transcription by Rev‐erbɑ (n = 6). H) Effects of RevRE site mutation on REV‐ERBɑ regulation of Adk‐S transcription (n = 6). I) ChIP assays showing recruitment of intestinal REV‐ERBɑ protein to Adk‐S promoter in mice (n = 8). J) Comparisons of Adk‐S mRNA levels in Bmal1‐iKO or Rev‐erbɑ‐iKO mice and controls at different diurnal time points (n = 6). K) Effects of Bmal1 on Adk‐S transcription in siRev‐erbɑ‐treated (Rev‐erbɑ‐deficient) cells (n = 6). Data are mean ± SEM, and analyzed by two‐tailed Student's t‐test (B–E, H, and K), one‐way ANOVA followed by Bonferroni post‐test (G), and two‐way ANOVA followed by Bonferroni posttest (F,I). * p  <  0.05, ** p  <  0.01, *** p < 0.001 and **** p < 0.0001.
Figure 7
Figure 7
Intestinal Rev‐erbα promotes adenosine absorption and cognitive performance. A) Discrimination index in NOR test during 2 h retention session in Rev‐erbα‐iKO and control mice (n = 8–10). B) Discrimination index in NOR during 24 h recall session in Rev‐erbα‐iKO and control mice (n = 8–10). C) Performance on SOL test in Rev‐erbα‐iKO and control mice (n = 8–10). D) Spontaneous alternations in Y maze test in Rev‐erbα‐iKO and control mice (n = 8–10). E) Adenosine levels in the small intestine, blood, and hippocampus from Rev‐erbα‐iKO and control mice (n = 6). F) Adenosine levels in the small intestine, blood, and hippocampus from Rev‐erbα‐iKO mice gavaged with adenosine or vehicle (n = 6). G) Discrimination index in NOR test during 2 h retention session in Rev‐erbα‐iKO mice gavaged with adenosine or vehicle (n = 8). H) Spontaneous alternations in Y maze test in Rev‐erbα‐iKO mice gavaged with adenosine or vehicle (n = 8). I) Discrimination index in NOR test during 2 h retention session in Rev‐erbα‐iKO and control mice treated with CCPA or vehicle (n = 6). J) Spontaneous alternations in Y maze test in Rev‐erbα‐iKO and control mice treated with CCPA or vehicle (n = 6). K) Discrimination index in NOR test in Rev‐erbα‐iKO and control mice treated with NECA or vehicle (n = 6). L) Spontaneous alternations in Y maze test in Rev‐erbα‐iKO and control mice treated with NECA or vehicle (n = 6). Discrimination indices were calculated as: (Time for novel object exploring – time for familiar object exploring)/(Time for novel object exploring + time for familiar object exploring). All behavioral tests were conducted at ZT6, and the analyzed samples were collected at ZT6. Data are mean ± SEM, and analyzed by two‐tailed Student's t‐test (A–E) and two‐way ANOVA followed by Bonferroni posttest (F–L). * p  <  0.05, ** p  <  0.01, *** p < 0.001 and **** p < 0.0001. R‐flox, Rev‐erbα‐flox; R‐iKO, Rev‐erbα‐iKO.
Figure 8
Figure 8
Liver clock does not affect cognitive function. A) Adenosine levels in the liver from Bmal1‐iKO and control mice (n = 6). B) Schematic illustration of the generation of hepatocyte‐specific Bmal1 knockout (Bmal1‐hKO) mice. C) PCR genotyping using mouse tails from Bmal1‐hKO and control (Bmal1‐flox) mice. D) Relative expression of hepatic Bmal1 mRNA and protein in Bmal1‐hKO and control mice. E) Discrimination index in NOR test during 2 h retention session in Bmal1‐hKO and control mice (n = 8). F) Discrimination index in NOR during 24 h recall session in Bmal1‐hKO and control mice (n = 8). G) Performance on SOL test in male Bmal1‐hKO and control mice (n = 8). H) Spontaneous alternations in Y maze test in male Bmal1‐hKO and control mice (n = 8). I) Adenosine levels in the liver, blood, small intestine, and hippocampus from male Bmal1‐hKO and control mice (n = 6). J) Relative expression of adenosine‐processing genes in the liver and small intestine of male Bmal1‐hKO and control mice (n = 6). K) Relative expression of ADK protein in the liver and small intestine of male Bmal1‐hKO and control mice. Three of nine samples from nine mice were pooled to generate three biological replicates. Discrimination indices were calculated as: (Time for novel object exploring – time for familiar object exploring)/(Time for novel object exploring + time for familiar object exploring). All behavioral tests were conducted at ZT6, and the analyzed samples were collected at ZT6. All Data are mean ± SEM, and analyzed by two‐tailed Student's t‐test (I,J). * p  <  0.05, ** p  <  0.01, and *** p < 0.001.

References

    1. Ralph M. R., Foster R. G., Davis F. C., Menaker M., Science 1990, 247, 975. - PubMed
    1. Dibner C., Schibler U., Albrecht U., Annu. Rev. Physiol. 2010, 72, 517. - PubMed
    1. Bunger M. K., Wilsbacher L. D., Moran S. M., Clendenin C., Radcliffe L. A., Hogenesch J. B., Simon M. C., Takahashi J. S., Bradfield C. A., Cell 2000, 103, 1009. - PMC - PubMed
    1. Buijs F. N., León‐Mercado L., Guzmán‐Ruiz M., Guerrero‐Vargas N. N., Romo‐Nava F., Buijs R. M., Physiology 2016, 31, 170. - PubMed
    1. Potter G. D., Skene D. J., Arendt J., Cade J. E., Grant P. J., Hardie L. J., Endocr Rev. 2016, 37, 584. - PMC - PubMed

LinkOut - more resources