. 2025 Sep;98(3):508-523.
doi: 10.1002/ana.27285. Epub 2025 Jun 20.

Timing of Changes in Alzheimer's Disease Plasma Biomarkers as Assessed by Amyloid and Tau PET Clocks

Affiliations

Timing of Changes in Alzheimer's Disease Plasma Biomarkers as Assessed by Amyloid and Tau PET Clocks

Marta Milà-Alomà et al. Ann Neurol. 2025 Sep.

Abstract

Objective: The objective of this study was to evaluate the timing of change of Alzheimer's disease (AD) plasma biomarkers (Aβ42/Aβ40, p-tau217, p-tau181, GFAP, and NfL) from six different assay platforms, alongside established AD biomarkers, using amyloid and tau positron emission tomography (PET)-based AD progression timelines.

Methods: Data from the Alzheimer's Disease Neuroimaging Initiative (ADNI), including 784 individuals with longitudinal amyloid PET and 359 with longitudinal tau PET, were analyzed to estimate the age at amyloid and tau PET positivity, respectively. Longitudinal plasma biomarker measurements were available from 190 individuals with an estimated amyloid PET positivity age and from 70 individuals with an estimated tau PET positivity age. In a subset of 17 clinical progressors, age at tau PET positivity strongly predicted symptom onset, allowing for estimation of symptom onset age. Biomarker trajectories based on time from amyloid or tau PET positivity or symptom onset were modelled using Generalized Additive Mixed models. Time intervals of significant biomarker change and the earliest timepoints at which biomarkers exceeded predefined abnormality thresholds were identified.

Results: All plasma biomarkers except NfL became abnormal prior to established thresholds for amyloid and tau PET positivity. Plasma Aβ42/Aβ40 became abnormal very early in both amyloid PET and tau PET timelines, while plasma GFAP became abnormal early in the tau PET timeline. Plasma Aβ42/Aβ40 levels plateaued, whereas plasma p-tau217, p-tau181, GFAP, and NfL levels increased throughout the modeled disease progression. Some variations in the timing of these changes were observed across different biomarker assays.

Interpretation: These findings suggest that the plasma Aβ42/Aβ40 may be useful in identifying individuals with very low levels of amyloid pathology, whereas p-tau, GFAP, and NfL may be useful in staging disease progression. ANN NEUROL 2025;98:508-523.


Conflict of interest statement

H.K. has served on scientific advisory boards and/or as a consultant for ALZpath and Roche, and has given lectures sponsored by Fujirebio and Roche. J.L.D. has/is served/serving as a consultant or on advisory boards for AlzPath Inc., and Quanterix. J.L.D. has received research support from Fujirebio and Roche Diagnostics in the past 2 years. J.L.D. has stock or stock options in AlzPath Inc. Y.L. is the co‐inventor of the technology “Novel Tau isoforms to predict onset of symptoms and dementia in Alzheimer's disease” which is in the process of licensing by C2N. N.J.A. has received speaking fees from Quanterix. These conflicts involved companies that are developers of the assays used in the study. S.E.S. has served on scientific advisory boards on biomarker testing and education for Eisai and Novo Nordisk and has received speaking fees for presentations on biomarker testing from Eisai, Eli Lilly, and Novo Nordisk. M.M.A., D.T., I.H., K.K.P., L.D.C., Z.S.S., B.S., G.T.B., D.L.R., J.C., M.B., E.A.M., Y.M., C.E.R., K.F., H.K., E.G.R., M.S., L.M.S., A.W.B., and W.Z.P. have nothing to report. [Correction added on 12 July 2025, after first online publication: The following text “S.E.S. has served on scientific advisory boards……. Novo Nordisk.” has been added in this version.]

Figures

FIGURE 1
FIGURE 1
Amyloid and tau PET trajectories as a function of age and years from amyloid and tau PET positivity. Individual amyloid (A, B) and tau (C, D) PET longitudinal trajectories, where each line connects multiple observations from the same individual. Points and line segments are color‐coded according to the cognitive status assigned at each observation (blue for CDR = 0, orange for CDR = 0.5, and red for CDR ≥ 1). Triangles represent APOE ε4 carriers and circles represent APOE ε4 non‐carriers. One value with a 18F‐flortaucipir mesial‐temporal tau PET SUVR > 4 was excluded for visualization. CDR = Clinical Dementia Rating; PET = positron emission tomography; SUVR = standardized uptake value ratio. [Color figure can be viewed at www.annalsofneurology.org]
FIGURE 2
FIGURE 2
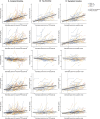
Established AD biomarkers and CDR‐SB as a function of estimated AD progression timelines. GAMMs with cubic spline basis and random intercepts were used to model established AD biomarkers and CDR‐SB as a function of years from amyloid PET positivity (A), years from tau PET positivity (B), and years from symptom onset (C). Dashed horizontal lines indicate the mean of the reference group, with shaded areas representing the 95% confidence interval. Solid vertical lines mark the time of abnormality compared to the reference group. Time periods with a significant rate of change are indicated with thicker lines. Individual trajectories are shown, where each line connects multiple observations from the same individual. Points and line segments are color‐coded according to the cognitive status assigned at each observation (blue for CDR = 0, orange for CDR = 0.5, and red for CDR ≥ 1). Triangles represent APOE ε4 carriers and circles represent APOE ε4 non‐carriers. One value with 18F‐flortaucipir mesial‐temporal tau PET SUVR > 4 and six values with 18F‐flortaucipir temporo‐parietal tau PET SUVR > 4 were excluded for visualization. AD = Alzheimer's disease; CDR = Clinical Dementia Rating; CDR‐SB = Clinical Dementia Rating Sum of Boxes; GAMMs = Generalized Additive Mixed Models; PET = positron emission tomography; SUVR = standardized uptake value ratio. [Color figure can be viewed at www.annalsofneurology.org]
FIGURE 3
FIGURE 3
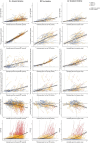
AD plasma biomarkers as a function of estimated AD progression timelines. GAMMs with cubic spline basis and random intercepts were used to model plasma biomarkers as a function of years from amyloid PET positivity (A), years from tau PET positivity (B), and years from symptom onset (C). Dashed horizontal lines indicate the mean of the reference group, with shaded areas representing the 95% confidence interval. Solid vertical lines mark the time of abnormality compared to the reference group. Time periods with a significant rate of change are indicated with thicker lines. Individual trajectories are shown, where each line connects multiple observations from the same individual. Points and line segments are color‐coded according to the cognitive status assigned at each observation (blue for CDR = 0, orange for CDR = 0.5, and red for CDR ≥ 1). Triangles represent APOE ε4 carriers and circles represent APOE ε4 non‐carriers. Outlier values were excluded for visualization: one for Roche Aβ42/Aβ40, two for Fujirebio Aβ42/Aβ40, one for Janssen p‐tau217, two for C2N p‐tau217, two for ALZpath p‐tau217, three for Fujirebio p‐tau217, three for Quanterix p‐tau181, three for Roche GFAP, two for Quanterix GFAP, one for Roche NfL, and one for Quanterix NfL. AD = Alzheimer's disease; CDR = Clinical Dementia Rating; GAMMs = Generalized Additive Mixed Models; PET = positron emission tomography. [Color figure can be viewed at www.annalsofneurology.org]
FIGURE 4
FIGURE 4
Timing for AD biomarker abnormality. Estimated years from amyloid PET positivity (A), tau PET positivity (B), or symptom onset (C) where each outcome measure becomes abnormal compared to the reference group. A and B also show the timing for AD biomarker abnormality in Centiloid units or mesial‐temporal tau PET SUVR values, respectively. Points depict the median and error bars depict the 95% confidence interval. Dashed vertical lines at time = 0 represent the time at amyloid PET positivity (18F‐florbetapir global cortical amyloid PET SUVR > 0.78) (A), tau PET positivity (18F‐flortaucipir mesial‐temporal tau PET SUVR > 1.41) (B) or symptom onset (C). Established AD biomarkers and CDR‐SB are shaded in grey. AD = Alzheimer's disease; CDR‐SR = Clinical Dementia Rating Sum of Boxes; PET = positron emission tomography; SUVR = standardized uptake value ratio. [Color figure can be viewed at www.annalsofneurology.org]

Update of

  • Timing of changes in Alzheimer's disease plasma biomarkers as assessed by amyloid and tau PET clocks.
    Milà-Alomà M, Tosun D, Schindler SE, Hausle Z, Li Y, Petersen KK, Dage JL, Du-Cuny L, Saad ZS, Saef B, Triana-Baltzer G, Raunig DL, Coomaraswamy J, Baratta M, Meyers EA, Mordashova Y, Rubel CE, Ferber K, Kolb H, Ashton NJ, Zetterberg H, Rosenbaugh EG, Sabandal M, Shaw LM, Bannon AW, Potter WZ; Alzheimer’s Disease Neuroimaging Initiative (ADNI); Foundation for the National Institutes of Health (FNIH) Biomarkers Consortium Plasma Aβ and Phosphorylated Tau as Predictors of Amyloid and Tau Positivity in Alzheimer’s Disease Project Team. Milà-Alomà M, et al. medRxiv [Preprint]. 2024 Nov 14:2024.10.25.24316144. doi: 10.1101/2024.10.25.24316144. medRxiv. 2024. Update in: Ann Neurol. 2025 Sep;98(3):508-523. doi: 10.1002/ana.27285. PMID: 39574864 Free PMC article. Updated. Preprint.

References

    1. Jack CR, Andrews JS, Beach TG, et al. Revised criteria for diagnosis and staging of Alzheimer's disease: Alzheimer's Association workgroup. Alzheimers Dement 2024;20:5143–5169. 10.1002/alz.13859. - DOI - PMC - PubMed
    1. McDade EM. Alzheimer Disease. Continuum (Minneap Minn) 2022;28:648–675. 10.1212/CON.0000000000001131. - DOI - PubMed
    1. Schindler SE, Atri A. The role of cerebrospinal fluid and other biomarker modalities in the Alzheimer's disease diagnostic revolution. Nat Aging 2023;3:460–462. 10.1038/s43587-023-00400-6. - DOI - PMC - PubMed
    1. Hansson O, Blennow K, Zetterberg H, Dage J. Blood biomarkers for Alzheimer's disease in clinical practice and trials. Nat Aging 2023;3:506–519. 10.1038/s43587-023-00403-3. - DOI - PMC - PubMed
    1. Schindler SE, Li Y, Li M, et al. Using Alzheimer's disease blood tests to accelerate clinical trial enrollment. Alzheimers Dement 2023;19:1175–1183. 10.1002/alz.12754. - DOI - PMC - PubMed