. 2025 Sep;12(34):e04851.
doi: 10.1002/advs.202504851. Epub 2025 Jun 20.

Lysosomal Cathepsin S Escape Facilitates Near Infrared Light-Triggered Pyroptosis Via an Antibody-Indocyanine Green Conjugate

Affiliations

Lysosomal Cathepsin S Escape Facilitates Near Infrared Light-Triggered Pyroptosis Via an Antibody-Indocyanine Green Conjugate

Fan Chen et al. Adv Sci (Weinh). 2025 Sep.

Abstract

Pyroptosis is a proinflammatory programmed cell death (PCD) that is causally linked to antitumor immune responses, but the therapeutic potential of pyroptosis has been limited by the lack of tumor-specific and controllable inducers. Here, it is reported that tumor-specific pyroptosis can be spatiotemporally triggered via near-infrared light (NIR-pyroptosis) by using an antibody-bound indocyanine green (ICG), a clinically approved and nontoxic fluorescent dye. Mechanistically, the key molecular steps are identified by which antibody-bound ICG generates excessive reactive oxygen species (ROS) within lysosomes after internalization, leading to lysosomal membrane damage and the cytosolic release of cathepsin S (CTSS), which cleaves gasdermin D (GSDMD), IL-18, and IL-1β independently of caspase-1, and thereby induces pyroptosis, while other cathepsin family members fail to cleave GSDMD. Functionally, in both ICAM1+ and HER2+ solid tumors, antibody-bound ICG-mediated NIR-pyroptosis triggers potent and durable antitumor immune responses through the release of proinflammatory cytokines. Furthermore, NIR-pyroptosis synergize with anti-PD-1 therapy by activating adaptive immune cells via upregulated IFN-γ secretion. The findings identify CTSS as a novel enzyme for GSDMD cleavage and establish NIR-pyroptosis as a non-apoptotic anticancer modality, providing a promising opportunity to overcome apoptosis resistance in current cancer therapies.

Keywords: antibody‐drug conjugate; anti‐tumor immunity; pyroptosis.


Conflict of interest statement

F.C., W.H.Z. and P.G. are co‐inventors of a patent filed by Zhejiang Cancer Hospital and Hangzhou Institute of Medicine, Chinese Academy of Sciences. X.F.L. and J.F. are shareholders of MabPlex. The other authors declare no conflict of interest.

Figures

Figure 1
Figure 1
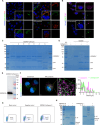
ICAM1 was identified as a suitable target for ATC. A) Volcano plot of DEGs from two ATC‐related datasets. B) Venn diagram showing the overlaps of upregulated genes between the selected datasets for ATC. C) Subcellular localization of 46 candidate genes encoding proteins. D) The expression of 4 upregulated surface proteins in human ATC cells (8505C). E) Immunofluorescence staining of ICAM1 on human ATC cells (TCO1 and 8505C) and normal 293T cells (Scale bars, 5 µm). F) Western blot analysis of ICAM1 on human ATC cells (TCO1 and 8505C) and normal 293T cells. G) Surface expression of ICAM1 on human ATC cells (TCO1 and 8505C) was compared against that of normal 293T cells by flow cytometry using PE‐labeled antibody. Nontargeting IgG was used as a control. H) Representative images showing cellular internalization of ICAM1 antibodies in human ATC cells (8505C) (Scale bars, 20 µm).
Figure 2
Figure 2
Pyroptotic effects of ICAM1‐ICG under NIR light irradiation on ATC cells. A) Schematic illustration of an ICAM1‐ICG (Left). Chemical structures of ADC linkers and warheads used in ICAM1‐ICG (Right). B) Validation of ICAM1‐ICG by SDS‐PAGE (left: Colloidal Blue staining, right: fluorescence). Diluted ICAM1 mAb was used as a control. C)The in vitro cytotoxicity of ICAM1‐ICG on ATC cells with a serial dose of NIR light irradiation, using propidium iodide (PI) staining. D) Representative phase‐contrast cell images of ATC cells treated with NIR‐pyroptosis. Arrows mark cells that show pyroptotic morphology. E) Representative TEM images of 8505C cells treated with NIR‐pyroptosis (Scale bars, 2 µm). F) Representative fluorescence images of intracellular ROS detection using DCFH‐DA staining (Scale bars, 50 µm). G) Heatmap of top 5000 genes with significant expression in 8505C cells treated with ICAM1‐ICG, NIR‐pyroptosis, Laser, or PBS, respectively, followed by RNA‐seq analysis (n = 3). H) GSEA of the pyroptosis signaling pathway, comparing the NIR‐pyroptosis and PBS groups. I) Western blot analysis of GSDMD cleavage in 8505C cells with different treatments (Up). NAC was used to eliminate intracellular ROS. Quantitative analysis of GSDMD‐N relative expression (Down) (n = 3, mean ± SEM). J) Representative phase‐contrast cell images of 8505C cells treated with solvent‐based ICG under NIR light. K) Western blot analysis of GSDMD cleavage in 8505C cells treated with solvent‐based ICG under NIR light. L) Flow cytometry analysis of NIR‐pyroptosis cytotoxicity after adding NAC. In C) and I), data are presented as mean ± SEM, and differences between each group are determined by One‐way ANOVA.
Figure 3
Figure 3
Recombinant GSDMD cleavage by cathepsin S. A) Confocal immunofluorescence images of lysosomes and ICAM1‐ICG after NIR‐pyroptosis (Scale bars, 10 µm). B) Confocal immunofluorescence images of LAMP1 and Gal‐3 after NIR‐pyroptosis (Scale bars, 10 µm). C) In vitro cleavage of GSDMD by recombinant cathepsin. D) Inhibitory effect of cathepsin S‐specific inhibitor on cathepsin S mediated cleavage of GSDMD. E) Western blot analysis of GSDMD cleavage mediated by cathepsin S. F) HiS‐SIM immunofluorescence images of GSDMD and cathepsin S in 8505C‐GSDMD‐EGFP cells after NIR‐pyroptosis (Scale bars, 5 µm). G) PI staining analysis after co‐expression of cathepsin S and GSDMD in 293T cells. H) In vitro cleavage of IL‐18 and IL‐1β by recombinant cathepsin S.
Figure 4
Figure 4
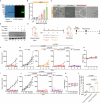
Antitumor effect of ICAM1‐targeted NIR‐pyroptosis in vivo. A) Schematic design of in vivo efficacy for NIR‐pyroptosis in an ATC tumor (8505C) xenografted nude mouse model. Laser1: 1 W cm−2, 64 s; Laser2: 1 W cm−2, 128 s. B) Image of NIR‐pyroptosis therapy in ATC tumor‐bearing nude mice. C) Tumor weight (at day 13) of mice in the ATC tumor xenografted nude mouse model. D) Tumor progression in the ATC tumor xenografted nude mouse model treated with PBS (n=5), ICAM1‐ICG (n=5), Laser (n=4), or NIR‐pyroptosis (n=5), respectively, and monitored by tumor volume measurement. E) Individual ATC tumor growth curves. F) Mouse body weight in the ATC tumor xenografted model. G) Schematic design of in vivo efficacy for NIR‐pyroptosis in a CT26.WT‐hICAM1 Balb/c mouse model. H) Image of excised CT26.WT‐hICAM1 tumors from mice treated with PBS (n=5), PD‐1 (n=5), NIR‐pyroptosis (n=4) or combination (n=5). I) Tumor weight (at day 12) of mice in the CT26.WT‐hICAM1 model. J) Tumor progression in the CT26.WT‐hICAM1 mouse model treated with PBS (n=5), PD‐1 (n=5), NIR‐pyroptosis (n=4) or combination (n=5), respectively, and monitored by tumor volume measurement. K) Individual CT26.WT‐hICAM1 tumor growth curves. L) Mouse bodyweight in the CT26.WT‐hICAM1 mouse model. In C) and I), data are presented as mean ± SD, and differences between each group are determined by One‐way ANOVA. In D) and J) data are presented as mean ± SD. The differences between each group are determined by Two‐way ANOVA.
Figure 5
Figure 5
RNA‐seq analysis of CT26.WT‐hICAM1 tumors. A) Heatmap of top 1000 genes with significant expression in CT26.WT‐hICAM1 tumors treated with PBS (n = 3), PD‐1 (n = 3), NIR‐pyroptosis (n = 3), and combination (n = 2), respectively, and analyzed by RNA‐seq. B) Enrichment analysis of DEGs in CT26.WT‐hICAM1 tumors of Balb/c mice in each treatment group. C) GSEA of CT26.WT‐hICAM1 tumors, comparing NIR‐pyroptosis and PBS groups. D) Expression levels of selected marker genes in CT26.WT‐hICAM1 tumors of each indicated group.
Figure 6
Figure 6
HER2‐targeted NIR‐pyroptosis induces antitumor effect and immunologic memory. A) Validation of HER2‐ICG by SDS‐PAGE (left: Colloidal Blue staining, right: fluorescence). Diluted HER2 mAb was used as a control. B) The in vitro cytotoxicity of HER2‐ICG on OE19 cells with a serial dose of NIR light irradiation using propidium iodide (PI) staining. C) Representative phase‐contrast cell images of OE19 cells treated with NIR‐pyroptosis. Arrows mark the cells showing pyroptotic morphology. D) Western blot analysis of GSDMD cleavage of OE19 cells with different treatments. GSDMD‐F, full‐length GSDMD; GSDMD‐N, N‐terminal cleavage product of GSDMD. E) Schematic design of in vivo efficacy for HER2‐targeted NIR‐pyroptosis in a CT26.WT‐hHER2 Balb/c mouse model, and the schematic design of the CT26.WT‐hHER2 tumor rechallenge model. Laser3: 1 W cm−2, 180 s; Laser4: 1 W cm−2, 300 s. F) Tumor progression in the CT26.WT‐hHER2 mouse model treated with PBS (n=7), PD‐1 (n=7), NIR‐pyroptosis (n=8) or combination (n=7), respectively, and monitored by tumor volume measurement. G) Individual CT26.WT‐ hHER2 tumor growth curves. H) Mouse body weight in the CT26.WT‐hHER2 model. I) Tumor progression in cured mice rechallenged with CT26.WT‐hHER2 tumor and monitored by tumor volume measurement. J) Individual CT26.WT‐hHER2 tumor growth curves. K) Mouse body weight in the rechallenge model. L) IFN‐γ secretion from splenocytes co‐cultured with CT26.WT‐hHER2 cells, as detected by ELISA. In L), data are presented as mean ± SD, and differences between each group are determined by One‐way ANOVA. In F) and I), data are presented as mean ± SD. The differences between each group are determined by Two‐way ANOVA.
Figure 7
Figure 7
Schematic illustration of the non‐canonical pyroptosis mechanism via NIR‐light activated antibody‐ICG conjugates.

References

    1. Llambi F., Green D. R., Curr. Opin. Genet. Dev. 2011, 21, 12. - PMC - PubMed
    1. Delbridge A. R., Grabow S., Strasser A., Vaux D. L., Nat. Rev. Cancer 2016, 16, 99. - PubMed
    1. Hsu S. K., Li C. Y., Lin I. L., Syue W. J., Chen Y. F., Cheng K. C., Teng Y. N., Lin Y. H., Yen C. H., Chiu C. C., Theranostics 2021, 11, 8813. - PMC - PubMed
    1. Yan J., Wan P., Choksi S., Liu Z. G., Trends Cancer 2022, 8, 21. - PMC - PubMed
    1. Liu Y., Song Z., Liu Y., Ma X., Wang W., Ke Y., Xu Y., Yu D., Liu H., Acta Pharm. Sin. B 2021, 11, 1513. - PMC - PubMed

LinkOut - more resources