. 2025 Oct;12(37):e03233.
doi: 10.1002/advs.202503233. Epub 2025 Jun 20.

NPR1 Promotes Lipid Droplet Lipolysis to Enhance Mitochondrial Oxidative Phosphorylation and Fuel Gastric Cancer Metastasis

Affiliations

NPR1 Promotes Lipid Droplet Lipolysis to Enhance Mitochondrial Oxidative Phosphorylation and Fuel Gastric Cancer Metastasis

Huafeng Fu et al. Adv Sci (Weinh). 2025 Oct.

Abstract

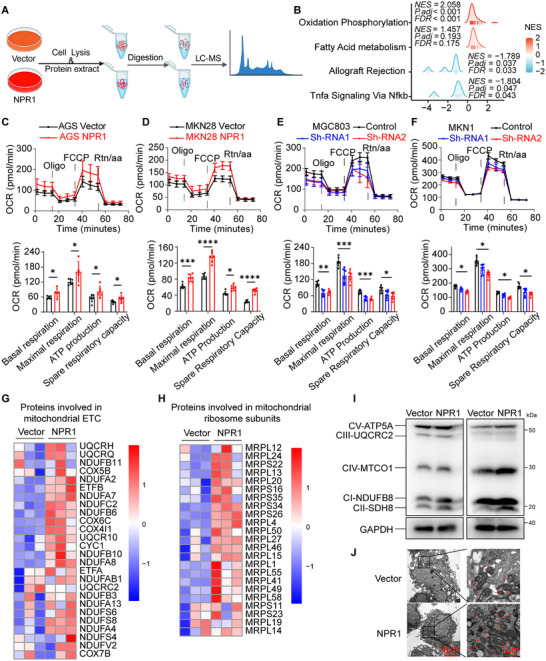
Metabolic reprogramming driven by oncogenes plays a critical role in promoting and sustaining multiple steps of gastric cancer metastasis. However, the key metabolic driver of metastasis that can lead to the development of targeted therapies for preventing and treating metastatic gastric cancer remains elusive. Here, it is identified that the transmembrane guanylate cyclase, natriuretic peptide receptor 1 (NPR1), promoted gastric cancer lymph node metastasis by activating lipid droplet lipolysis and enhancing mitochondrial oxidative phosphorylation (OXPHOS). Clinical analysis reveals that elevated NPR1 protein level is correlated with increased lymph node metastasis and shorter patient survival. Functionally, NPR1 induced lipolysis of stored lipid droplets, releasing bioavailable fatty acids that are imported into mitochondria to upregulate OXPHOS, thus fueling the energy required for the metastasis of gastric cancer cells. Mechanistically, NPR1 activates protein kinase cGMP-dependent 1 (PRKG1 or PKG), which directly bound to and activated hormone-sensitive lipase (HSL) by phosphorylation at residues Ser855 and Ser951, thereby increasing lipolysis. Furthermore, targeted delivery of NPR1 siRNA using engineered exosome mimetics effectively suppressed gastric cancer metastasis. Taken together, these findings elucidate the NPR1-driven metabolic mechanism underlying gastric cancer metastasis and suggest NPR1 as a promising therapeutic target for patients with metastatic gastric cancer.

Keywords: engineered cell membrane‐derived exosome mimetics; gastric cancer; lipid droplet; lipolysis; lymph node metastasis; mitochondrial oxidative phosphorylation; natriuretic peptide receptor 1.


Conflict of interest statement

The authors declare no conflict of interest.

Figures

Figure 1
Figure 1
NPR1 is a tumor metastasis‐related gene in gastric cancer. A) Representative images of IHC staining for NPR1 expression in gastric cancer and adjacent normal tissue. The score was determined by assessing the strength and extent of immunopositivity, n = 50, p‐values are calculated using Wilcoxon matched‐pairs signed rank test. B) Statistical analysis of NPR1 protein expression in gastric cancer and adjacent normal tissue, n = 50, p‐values are calculated using Chi‐Squared test. C–E) Representative images of IHC staining for NPR1 and the percentages of cases with different NPR1 expression levels in T stage, lymph node metastasis, and TNM stages are shown, n (NPR1‐High) = 83, n (NPR1‐Low) = 83, p‐values are calculated using Chi‐Squared test. F. Representative images of IHC staining for NPR1 expression in metastatic gastric cancer and primary tumors, n = 30, p‐values are calculated using Friedman's ANOVA tests. G–I) Kaplan–Meier survival analysis of the overall survival of gastric cancer patients with low versus high NPR1 expression. Survival analysis was carried out using univariate Cox and log‐rank tests. * p < 0.05, ** p < 0.01, *** p < 0.001, **** p < 0.0001. GC: gastric cancer. LVI: lymphovascular invasion. LNM: lymph node metastasis.
Figure 2
Figure 2
Elevated NPR1 promotes gastric cancer cell invasion and metastasis. A) Protein levels of GES1, AGS, MKN28, MGC803, MKN45, SNU1 and MKN1. B) AGS, MKN28 and MGC803 cells were transfected with NPR1 cDNA, whereas MGC803 and MKN1 cells were transfected with NPR1 shRNAs. Transfection efficiencies were assessed using western blotting. C) The migration and invasive abilities conveyed by NPR1 knockdown or NPR1 overexpression cells were measured using Transwell assay and Matrigel Invasion assay. Scale bar = 50 µm. Data presented as mean ± SD, n = 3, p‐values are calculated using two‐way ANOVA tests. D) The migration abilities conveyed by NPR1 knockdown or NPR1 overexpression cells were measured using Wound‐healing assay. Scale bar = 200 µm. Data presented as mean ± SD, n = 3, p‐values are calculated using two‐way ANOVA tests. E) Staining of F‐actin in Vector and NPR1 overexpressing cells. Scale bar = 10 µm. F) when cultured in 3D Matrigel, NPR1 overexpression cells appeared to show an aggressive morphology with protrusion of longer podosomes. Scale bar = 100 µm. G) The effect of NPR1 overexpression on the proliferation of gastric cancer cells was detected by CCK‐8 assay. Data presented as mean ± SD, n = 5, p‐values are calculated using two‐way ANOVA tests. H) Images of popliteal lymph nodes. I) Statistical analysis of the volume and the presence of metastasis in popliteal lymph nodes, n = 7, Mann–Whitney test was used for comparing lymph node volumes, and Fisher's Exact test was used for comparing the presence of metastasis in lymph nodes. J) The presence of metastasis in the lymph node was confirmed by H&E and CK‐pan staining. Scale bar = 100 µm. K) GC006‐03 cell was transfected with NPR1 cDNA and selected for clones that stably express NPR1 upon induction. Transfection efficiencies were assessed using western blotting. L) Schematic view of the popliteal lymph node metastasis mouse model treated by doxycycline. M) Images of popliteal lymph nodes, and statistical analysis of the volume and the presence of metastasis in lymph nodes in popliteal lymph nodes, n = 5, Mann–Whitney test was used for comparing lymph node volumes, and Fisher's Exact test was used for comparing the presence of metastasis in lymph nodes. N) The presence of metastasis in the lymph node was confirmed by CK‐pan staining. Scale bar = 100 µm. * p < 0.05, ** p < 0.01, *** p < 0.001, **** p < 0.0001.
Figure 3
Figure 3
NPR1 facilitates mitochondrial metabolism and ATP production. A) Schematic view of the label‐free proteomic sequencing of NPR1 overexpression and control cells. B) GSEA analysis of the proteomic sequencing data. C–F) OCR analysis of NPR1 overexpression or knockdown cells, and statistical analysis of the mitochondrial respiration capacity and ATP production. Data presented as mean ± SD, n = 6, p‐values are calculated using two‐way ANOVA tests. G) Heat map of altered expression of proteins involved in mitochondrial electron transfer chain in cells after NPR1 overexpression. H) Heat map of altered expression of proteins involved in mitochondrial ribosome subunits in cells after NPR1 overexpression. I) The increase of mitochondrial mass by NPR1 overexpression was verified by Western blotting. J) The numbers of mitochondria in NPR1 overexpression cells were detected by transmission electron microscopy analyses. * p < 0.05, ** p < 0.01, *** p < 0.001, **** p < 0.0001.
Figure 4
Figure 4
NPR1 promotes lipid droplet lipolysis to enhance β‐oxidation and fuel gastric cancer metastasis. A) Schematic view of the targeted lipidomic sequencing of NPR1 overexpression and control cells. Cells were treated with BSA‐conjugated oleic acid (50 µm) to increase the intracellular lipid accumulation before sampling. B) Analysis of the proportion of different lipid metabolites. C) The level of diacylglycerol and monoacylglycerol in Vector and NPR1 overexpressing cells. Data presented as mean ± SD, n = 3, p‐values are calculated using multiple t‐tests. D) The level of triacylglycerol in Vector and NPR1 overexpressing cells. Data presented as mean ± SD, n = 3, p‐values are calculated using multiple t tests. E) Staining of lipid droplets in Vector and NPR1 overexpressing cells. Data presented as mean ± SD, n = 3, p‐values are calculated using unpaired Student's t‐tests. F) Staining of lipid droplets in Control and NPR1 knockdown cells. Data presented as mean ± SD, n = 3, p‐values are calculated using unpaired Student's t‐tests. G) The migration and invasion abilities of NPR1 overexpressing cells in a background of DMSO versus oligomycin or etomoxir exposure were analyzed. Scale bar = 50 µm. Data presented as mean ± SD, n = 3, p‐values are calculated using two‐way ANOVA tests. H) Schematic view of the popliteal lymph node metastasis mouse model treated by etomoxir. I) Representative images of the popliteal lymph node and primary tumor in the footpad. J) Images of popliteal lymph nodes. And statistical analysis of the volume and the presence of metastasis in popliteal lymph nodes, n = 7, Mann–Whitney test was used for comparing lymph node volumes, and Fisher's Exact test was used for comparing the presence of metastasis in lymph nodes. K) The presence of metastasis in the lymph node was confirmed by H&E and CK‐pan staining. Scale bar = 100 µm. * p < 0.05, ** p < 0.01, *** p < 0.001, **** p <0.0001. Oligo: oligomycin. Eto: etomoxir.
Figure 5
Figure 5
NPR1 promotes lipid droplet lipolysis by activating lipase HSL. A) Schematic view of the catabolism of lipid droplets. B) The migration and invasion abilities of NPR1 overexpressing cells in a background of DMSO versus ATGL inhibitor or HSL inhibitor exposure were analyzed. Scale bar = 50 µm. Data presented as mean ± SD, n = 3, p‐values are calculated using two‐way ANOVA. C) Western blot was used to evaluate the transfection efficiency of siHSL in Vector and NPR1 overexpression cells. D) The migration and invasion abilities of NPR1 overexpressing cells with HSL knockdown. Scale bar = 50 µm. Data presented as mean ± SD, n = 3, p‐values are calculated using two‐way ANOVA. E) Western blot was used to evaluate the transfection efficiency of siHSL in MGC803 cells. F) The migration and invasion abilities of MGC803 cells with HSL knockdown. Scale bar = 50 µm. Data presented as mean ± SD, n = 3, p‐values are calculated using two‐way ANOVA test. G) Staining of lipid droplets in Vector and NPR1 overexpressing cells in a background of HSL silence. Data presented as mean ± SD, n = 3, p‐values are calculated using unpaired Student's t‐test. H,I) OCR analysis of NPRI‐overexpressing GC006‐03 (H) and AGS (I) gastric cancer in the context of HSL knockdown, and statistical analysis of the mitochondrial respiration capacity and ATP production. Data presented as mean ± SD, n = 6 (H), n = 5 (I), p‐values are calculated using two‐way ANOVA test. * p < 0.05, ** p < 0.01, *** p < 0.001, **** p < 0.0001. TAG: Triacylglycerol. DAG: diacylglycerol. MG: monoacylglycerol. ATGL: adipose triglyceride lipase. HSL: hormone‐sensitive lipase. MGL: monoglyceride lipase. FFA: Free fatty acid.
Figure 6
Figure 6
Protein kinase G (PKG) directly binds to HSL for NPR1‐induced activation of HSL. A) Western blotting was used to detect the protein level of HSL in NPR1 overexpressing or knockdown cells. B) Western blots on immunoprecipitation products using anti‐FLAG M2 affinity gel. HEK293T cells were transfected with HSL‐HA/PKG‐FLAG (left) or PKG‐HA/HSL‐FLAG (Right). 48 h later, cell lysates were prepared and used for the studies. C) Coimmunoprecipitation of endogenous PKGα with endogenous HSL from MGC803 and MKN1 cell lysates. D) GST pull‐down assays showing purified GST‐ PKGα binding with purified HSL and endogenous HSL in various cell lysates. E) Immunofluorescence staining showing colocalization of endogenous PKGα/β and HSL in MGC803 and AGS cells. F) Scheme of molecular docking. 3D structures of PKG (below) and HSL (above). G) Diagram for human HSL domain architecture. HSL contains a tissue specific additional N‐terminal domain (1 to 342), an N‐terminal domain (343 to 665), and a regulatory domain N‐terminal kinase domain (666 to 1076). H) Western blots on the input and immunoprecipitation products for interaction between PKGα and FLAG‐tagged truncated HSL. HEK293T cells were similarly transfected/processed, as described in (B). I) Coomassie blue staining of the purified PKGα‐FLAG protein from HEK293T cells and commercially available purified HSL‐HIS protein. J) Western blots on the products from in vitro kinase assays assessing affinity‐purified PKGα phosphorylation of HSL. PKGα proteins were overexpressed/purified using the EZview Red anti‐FLAG M2 affinity gel from the HEK293T cells transiently transfected with pRK5‐PKGα‐FLAG plasmid. K) The migration and invasion abilities of NPR1 overexpressing cells with PKG inhibition. Scale bar = 50 µm. Data presented as mean ± SD, n = 3, p‐values are calculated using two‐way ANOVA tests. * p < 0.05, ** p < 0.01.
Figure 7
Figure 7
PKG phosphorylates HSL at S855 and S951 for NPR1‐induced activation of HSL. A) Coomassie blue staining of the commercially available purified PKGα‐GST protein and HSL‐HIS protein. B) Phosphorylation sites identified by LC‐MS/MS. C) Phosphorylation sites of PKG on HSL, Phosphorylation modification sites detected by LC‐MS using in vitro kinase reaction products. the reaction products (left), specific phosphorylation sites predicted by iGPS 1.0 software (right). D) Western blotting was used to confirm the phosphorylation of HSL by commercially available purified PKGα‐GST protein in vitro kinase assay product. E) Western blotting was used to confirm the phosphorylation level of HSL in NPR1 overexpressing or knockdown cells. F) Western blots on WT and HSL‐KO AGS cell lysates. G) Western blotting was used to detect the protein expression efficiency of NPR1, HSLWT, and HSLS855A/S951A in two AGS HSL‐KO cells. H) The migration and invasion abilities of NPR1 overexpressing AGS HSL‐KO cells with HSLWT or HSLS855A/S951A overexpression. Scale bar = 50 µm. Data presented as mean ± SD, n = 3, p‐values are calculated using two‐way ANOVA tests. I) Staining of lipid droplets in NPR1 overexpressing AGS HSL‐KO cells with HSLWT or HSLS855A/S951A overexpression. Cells were loaded with oleic acid (50 µm) to increase the intracellular LD content before DNA transfection. Data presented as mean ± SD, n = 3, p‐values are calculated using two‐way ANOVA tests. * p < 0.05, ** p < 0.01, *** p < 0.001, **** p < 0.0001.
Figure 8
Figure 8
Targeted delivery of NPR1 siRNA by engineered exosome mimics effectively suppressed gastric cancer metastasis. A) Schematic view of the development of NPR1 siRNA (siNPR1) loaded engineered RGD‐exosome‐mimetic vesicles. B,C) EMs and RGD‐EMs Characterization, the morphology of EMs and RGD‐EMs was visualized by transmission electron microscopy (left), and the size distribution of EMs and RGD‐EMs was measured by a NanoFCM (right). Scale bar = 10 nm. D,E) Confocal Microscopy was used to examine the cellular uptake of RGD‐EMs or NPR1 siRNA‐loaded RGD‐EMs in MGC803 cells. Scale bar = 10 µm. F) Western blotting was used to examine the knockdown efficiency of expression efficiency of NPR1 in MGC803 cells with free NPR1 siRNA or NPR1 siRNA‐loaded RGD‐EMs treatment. G,H) In vivo distribution of bioengineered siRNA‐loaded RGD‐EMs in a popliteal lymph node metastasis mouse model. I) Schematic illustration of the treatment schedule in the popliteal lymph node metastasis mice model. J) Images of popliteal lymph nodes. K) Statistical analysis of the volume and the presence of metastasis in popliteal lymph nodes, n = 5, Mann–Whitney test was used for comparing lymph node volumes, and Fisher's Exact test was used for comparing the presence of metastasis in lymph nodes. L) The presence of metastasis in the lymph node was confirmed by H&E and CK‐pan staining. Scale bar = 100 µm. * p < 0.05, ** p < 0.01.

References

    1. Sung H., Ferlay J., Siegel R. L., Laversanne M., Soerjomataram I., Jemal A., Bray F., Ca‐Cancer J. Clin. 2021, 71, 209. - PubMed
    1. Vos E. L., Nakauchi M., Gönen M., Castellanos J. A., Biondi A., Coit D. G., Dikken J. L., D'ugo D., Hartgrink H., Li P., Nishimura M., Schattner M., Song K. Y., Tang L. H., Uyama I., Vardhana S., Verhoeven R. H. A., Wijnhoven B. P. L., Strong V. E., Ann. Surg. 2023, 277, 339. - PMC - PubMed
    1. Joshi S. S., Badgwell B. D., Ca‐Cancer J. Clin. 2021, 71, 264. - PMC - PubMed
    1. Fares J., Fares M. Y., Khachfe H. H., Salhab H. A., Fares Y., Signal Transduction Targeted Ther. 2020, 5, 28. - PMC - PubMed
    1. Zanotelli M. R., Zhang J., Reinhart‐King C. A., Cell Metab. 2021, 33, 1307. - PMC - PubMed

Substances

LinkOut - more resources