. 2025 Jun 30;39(12):e70749.
doi: 10.1096/fj.202500965R.

Deciphering the Regulatory Networks of the Migrasome-Associated Cell Subpopulation in Heterotopic Ossification via Multi-Omics Analysis

Affiliations

Deciphering the Regulatory Networks of the Migrasome-Associated Cell Subpopulation in Heterotopic Ossification via Multi-Omics Analysis

Guanzhi Li et al. FASEB J. .

Abstract

Heterotopic ossification (HO) is a pathological process where bone forms in extraskeletal tissues, often occurring as a complication of tissue repair following injury. This condition can lead to movement limitations, pain, and functional impairment. However, the underlying pathomechanisms remain poorly understood. This study aims to elucidate key biomolecular networks involved in HO through a comprehensive multi-omics analysis. Single-cell, bulk, and spatial transcriptome datasets were obtained from the Gene Expression Omnibus (GEO) database. Migrasome score analysis identified a critical cell subtype associated with HO. Key genes were identified through high-dimensional weighted gene co-expression network analysis (hdWGCNA), machine learning, and dataset validation from clinical samples. Then we analyzed immune infiltration, microRNA (miRNA) networks, co-expression networks, transcription factor (TF) regulatory networks, and signaling pathways to investigate potential regulatory mechanisms of HO. Spatial transcriptomics revealed the spatial patterns of cell subpopulation distribution and key molecule expression. Experimental validation further confirmed the expression patterns of key molecules in HO. As a result, we identified mesenchymal lineage cells (MLin) as the key migrasome-associated cell subtype and determined peptidylprolyl isomerase B (Ppib) and transgelin (Tagln) as the key molecules. We constructed a regulatory network of these biomolecules and clarified their spatial distribution. Notably, the expression of Ppib and Tagln is temporally correlated with HO progression. Collectively, the identification of Ppib and Tagln, along with the construction of key biomolecular networks, facilitates the discovery of novel biomarkers for HO, offering promising potential for the development of preventive and therapeutic strategies.

Keywords: hdWGCNA; heterotopic ossification; machine learning; migrasome; single‐cell RNA sequencing; spatial transcriptomics.


Conflict of interest statement

The authors declare no conflicts of interest.

Figures

FIGURE 1
FIGURE 1
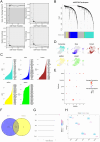
Annotation of cells. (A) According to the significant components identified in PCA, the cells were divided into 17 clusters utilizing the UMAP algorithm. (B) Annotation of 17 clusters of cells. (C) Doplot bubble plot of 11 cell types and cell markers. (D) Differences in the percentages of 11 cell types between the two sample groups. (E) Heatmap showing the activity of different metabolic pathways in different cell types.
FIGURE 2
FIGURE 2
Quantification of migrasome scores, cell communication analysis, and secondary clustering. (A) Quantification of migrasome scores and differences between the 11 cell types across the two groups. (B) Volcanic map of differential genes in MLin; blue represents differentially down‐regulated genes, and red represents differentially up‐regulated genes. (C) Communication interactions network between 12 positive cell types; the edge width represents the probability and intensity of communication between cells. (D) The comparison of the counts of interactions in the communication network between the 12 positive cell types decreased from left to right, and the highest was High_MLin. (E) Variance ordering plot for each PC. (F) Visualization of PCA and distribution of PCs; colors stand for samples, and points stand for cells. (G) According to the important components available in PCA, the cells were divided into 6 clusters by the UMAP algorithm. (H) Differences of the proportion of 6 clusters between the two sample groups.
FIGURE 3
FIGURE 3
The key genes of HO were screened by hdWGCNA and ML. (A) Soft threshold selection. (B) The dendrogram of 5 gene modules. (C) kMEs for feature genes in different modules. (D) UMAP plot of MLin with ME staining. (E) Module activity for 5 MLin clusters. (F) Venn diagram showing the intersection between differential genes and module genes from hdWGCNA. (G) Feature genes selected by RF. (H) Analysis of gene difference between two groups of samples.
FIGURE 4
FIGURE 4
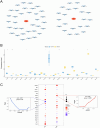
MiRNA networks of key genes and correlations between key genes and disease‐regulating genes in HO. (A) MiRNA networks of key genes, with red indicating mRNAs and blue indicating miRNAs. (B) Differences in expression of disease‐regulating genes. (C) Pearson correlation analysis of key genes and disease‐regulating genes, where blue represents negative correlation and red represents positive correlation.
FIGURE 5
FIGURE 5
Analysis of the co‐expression and correlation between disease‐regulating genes and Tagln in single cells. (A–E) Analysis of the co‐expression and correlation between each disease‐regulating gene and Tagln, including UMAP visualization, gene expression correlation heatmaps, and scatter regression analysis.
FIGURE 6
FIGURE 6
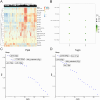
SCENIC analysis. (A) Heatmap showing the regulon activity score for each cell. (B) Bubble diagram showing specificity of regulon in Hsco and Lsco. (C) Scatter diagram showing the top 5 regulons in the group with high expression (Hexp) of Ppib. (D) Scatter diagram showing the top 5 regulons in the group with high expression (Hexp) of Tagln.
FIGURE 7
FIGURE 7
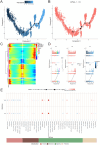
Cell development trajectory. (A, B) Cell pseudotime analysis and developmental trajectory. (C) The gene expression dynamics of each pigment cell branch. (D) Relationship between key gene expression and cell development trajectory. (E) Bubble plot showing the enrichment results of Tagln and Ppib in different pathways.
FIGURE 8
FIGURE 8
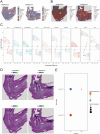
Deconvolution analysis and expression of HO key genes in the spatial transcriptome. (A, B) The cell types and proportions for each spot. (C) Differential genes for each cell type. (D, E) Expression of HO key genes in spatial transcriptome samples.
FIGURE 9
FIGURE 9
Experimental validation of key gene expression in HO. qRT–PCR analysis of Ppib and Tagln expression in murine HO models at 1 (A), 4 (B), 7 (C), and 10 (D) weeks post‐injury.

Similar articles

References

    1. Xu R., Hu J., Zhou X., and Yang Y., “Heterotopic Ossification: Mechanistic Insights and Clinical Challenges,” Bone 109 (2018): 134–142. - PubMed
    1. Matsuo K., Chavez R. D., Barruet E., and Hsiao E. C., “Inflammation in Fibrodysplasia Ossificans Progressiva and Other Forms of Heterotopic Ossification,” Current Osteoporosis Reports 17, no. 6 (2019): 387–394. - PMC - PubMed
    1. Hoyt B. W., Pavey G. J., Potter B. K., and Forsberg J. A., “Heterotopic Ossification and Lessons Learned From Fifteen Years at War: A Review of Therapy, Novel Research, and Future Directions for Military and Civilian Orthopaedic Trauma,” Bone 109 (2018): 3–11. - PubMed
    1. Wong K. R., Mychasiuk R., O'Brien T. J., Shultz S. R., McDonald S. J., and Brady R. D., “Neurological Heterotopic Ossification: Novel Mechanisms, Prognostic Biomarkers and Prophylactic Therapies,” Bone Research 8, no. 1 (2020): 42. - PMC - PubMed
    1. Zhang Y., Zhang M., Xie Z., et al., “Research Progress and Direction of Novel Organelle‐Migrasomes,” Cancers (Basel) 15, no. 1 (2022): 134. - PMC - PubMed

LinkOut - more resources