. 2025 Jun 30;39(12):e70744.
doi: 10.1096/fj.202500374R.

Transcriptomic Differences Between Immortalized Oral and Skin Keratinocytes

Affiliations

Transcriptomic Differences Between Immortalized Oral and Skin Keratinocytes

Chen Han et al. FASEB J. .

Abstract

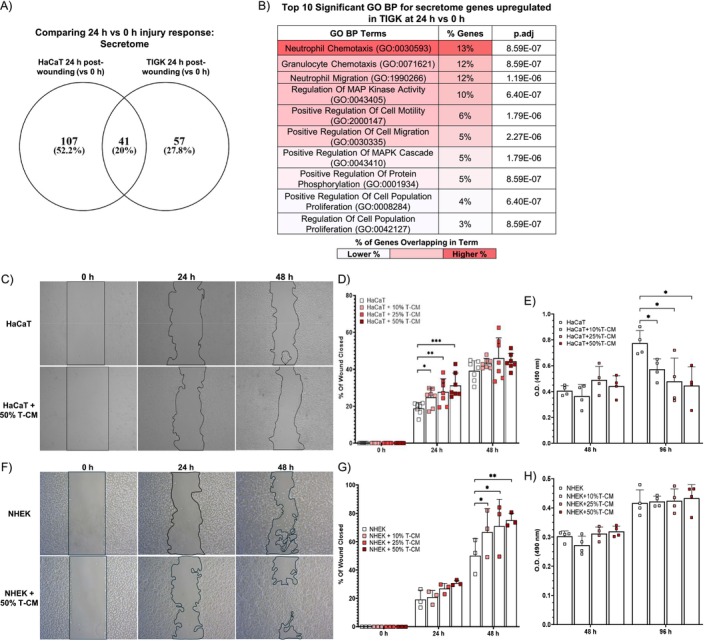
Compared to skin wounds, oral mucosal wounds heal quicker with less inflammation, faster re-epithelialization, and minimal scarring. Site-specific keratinocytes may be one differentiating factor. This study used immortalized skin and oral keratinocytes (HaCaT and TIGK), which maintain fidelity to their primary cell counterpart, to examine functional and transcriptional differences that might contribute to the differential wound healing at the two sites. Oral keratinocytes were found to have an enhanced migratory and proliferative capacity. To examine the transcriptomic differences, we generated an mRNA-sequencing gene expression dataset utilizing HaCaT and TIGK. Differentially expressed genes (DEGs) were identified between HaCaT and TIGK at baseline and throughout in vitro healing. DEGs in HaCaT and TIGK following injury were also identified when compared to each respective cell type's unwounded gene expression levels. Gene set enrichment analyses were performed to understand the biological significance of the DEGs. Processes related to interferon (IFN) signaling were uniquely enriched in TIGK. TIGK also exhibited a faster transcriptional response to injury and differential expression of integrins and matrix metalloproteinases (MMPs). When grown on extracellular matrix (ECM) proteins, TIGK retained its enhanced migratory capacity over HaCaT. Lastly, TIGK displayed a post-injury secretome that promoted keratinocyte migration. Our comparative analyses suggest that specific transcriptomic differences between oral and skin keratinocytes at unwounded baseline and in response to injury may underlie the distinct wound healing phenotypes observed in these two tissues. This work also provides a new resource of HaCaT and TIGK gene expression data that can be used for future analyses.

Keywords: keratinocytes; mouth mucosa; skin; transcription factors; wound healing.


Conflict of interest statement

The authors declare no conflicts of interest.

Figures

FIGURE 1
FIGURE 1
TIGK exhibits enhanced migratory and proliferative capacity over HaCaT in vitro. (A) Representative photos of in vitro vertical HaCaT and TIGK wounds closing after one × one cross‐scratching. A black line outlines areas not covered by cells. (B) Rate of cell migration, expressed as a percentage of wound closed at each time point. N = 18–19. (C) Proliferation of HaCaT and TIGK at 48 and 96 h post‐seeding was assessed by MTS assay. N = 6, with each dot representing a biological replicate that consists of 3 technical replicates. Bars indicate mean ± SD for all graphs. *p < 0.01, **p < 0.0001. Two‐way ANOVA with a two‐stage linear step‐up procedure of Benjamini, Krieger, and Yekutieli post hoc testing (vs. HaCaT).
FIGURE 2
FIGURE 2
HaCaT and TIGK maintain transcriptomic fidelity to their respective parental primary cells NHEK and NHOK. The top 500 expressed genes of unwounded HaCaT, TIGK, NHEK (GSE184119), and NHOK (GSE262505) were identified using raw count matrices from mRNA‐sequencing datasets. Venn diagram comparing the top 500 expressed genes between (A) HaCaT and NHEK, and (B) TIGK and NHOK. Top 10 significantly enriched reactome terms for the top 500 expressed genes in unwounded (C) HaCaT, (D) TIGK, (E) NHEK, and (F) NHOK. Venn diagram comparing the top 10 significantly enriched reactome terms for (G) HaCaT and NHEK and (H) TIGK and NHOK. Table listing the shared and unshared top 10 significantly enriched reactome terms for (I) HaCaT and NHEK, and (J) TIGK and NHOK.
FIGURE 3
FIGURE 3
Comparative analysis of the transcriptomic response of HaCaT and TIGK to injury reveals they cluster primarily by cell type and then by time post‐wounding. (A) Principal component analysis plot of mRNA‐sequencing expression data. A colored point on the graph represents each sample. The hours (h) post‐wounding are depicted by 0, 6, and 24, with 0 representing unwounded baseline HaCaT and TIGK. The x‐axis and y‐axis are the first and second principal components, respectively. (B) Heatmap representing similarities of the mean gene expression profiles grouped by keratinocyte cell type (oral vs. skin) and time post‐wounding: 0, 6, and 24 h. Each square and its color represents aggregate Pearson's correlation coefficient values between each experimental group (cell type and time post‐wounding).
FIGURE 4
FIGURE 4
Enrichment of genes up‐regulated in TIGK relative to HaCaT at 0, 6, and 24 h post‐wounding reveal that wound‐activated transcriptional networks are present in both unwounded and wounded TIGK. (A) Volcano plot showing the differentially expressed genes in HaCaT and TIGK at 0, 6, and 24 h. (B) Significantly enriched reactome terms for genes up‐regulated in TIGK relative to HaCaT at 0 h. (C) Venn diagram comparing the up‐regulated genes in TIGK relative to HaCaT at 0, 6, and 24 h. Top 10 significantly enriched (D) gene ontology biological processes (GO BP) and (E) reactome terms for genes up‐regulated in TIGK relative to HaCaT at 0, 6, and 24 h. Top 10 significantly enriched gene set enrichment analyses identified GO BP and reactome terms for TIGK relative to HaCaT at (F) 0 h, (G) 6 h, and (H) 24 h.
FIGURE 5
FIGURE 5
Type I interferon (IFN‐1) stimulation of HaCaT following in vitro wounding significantly enhances HaCaT expression of IFN‐stimulated genes and cell migration, but not proliferation. (A) Relative gene expression levels of IFN‐1 stimulated genes at 24 h post‐wounding in HaCaT grown in media supplemented with or without 10 Units/mL IFN‐1 for 24 h. Gene expression levels were normalized to GAPDH and expressed as 2−ΔΔCT. N = 6, with each dot representing a biological replicate that consists of 3 technical replicates. (B) Representative photos of in vitro vertical HaCaT and TIGK wounds closing after one × one cross‐scratching. A black line outlines areas not covered by cells. (C) Rate of cell migration, expressed as the percentage of wound closed at each time point. N = 11–13. (D) Proliferation of HaCaT grown in media supplemented with or without 10 Units/mL IFN‐1 at 48 h and 96 h post‐seeding was assessed by MTS assay. N = 3, with each dot representing a biological replicate that consists of 3 technical replicates. (E) Representative photos of in vitro vertical TIGK wounds treated with type I interferon receptors (IFN‐1 R) closing after one × one cross‐scratching. A black line outlines areas not covered by cells. (F) Rate of cell migration, expressed as the percentage of wound closed at each time point. N = 3–4. Bars indicate mean ± SD for all graphs. *p < 0.05, **p < 0.01, ***p < 0.0001. Multiple two‐tailed unpaired t‐tests with a two‐stage step‐up procedure of Benjamini, Krieger, and Yekutieli post hoc testing (vs. HaCaT) were used in A. Two‐way ANOVA with a two‐stage step‐up procedure of Benjamini, Krieger, and Yekutieli post hoc testing (vs. HaCaT) was used in C, D, and F.
FIGURE 6
FIGURE 6
TIGK exhibits a more robust response to acute injury as well as a faster activation of gene sets involved in wound healing processes relative to HaCaT. (A) Volcano plots showing the differentially expressed genes in HaCaT and TIGK at 6 or 24 h versus 0 h. (B) Venn diagrams comparing the up‐regulated genes in HaCaT and TIGK at 6 or 24 h versus 0 h. Top 10 significantly enriched (C) gene ontology biological processes (GO BP) and (D) reactome terms for genes differentially upregulated in TIGK at 6 versus 0 h. Top 10 significantly enriched (E) GO BP and (F) reactome pathway terms for genes differentially upregulated in HaCaT at 6 versus 0 h. Top 10 significantly enriched gene set enrichment analysis identified GO BP and reactome terms for TIGK at (G) 6 h or (H) 24 versus 0 h and for HaCaT at (I) 6 h or (J) 24 versus 0 h.
FIGURE 7
FIGURE 7
The transcription factor expression profile in uninjured and injured TIGK enables TIGK to have a more rapid and robust response to wounding relative to HaCaT. (A) Venn diagram comparing the transcription factors up‐regulated in TIGK versus HaCaT at 0, 6, and 24 h. Heatmap of all differentially expressed transcription factors in (B) HaCaT and (C) TIGK at 6 vs. 0 h. Each column of the heatmap represents an independent sample. (D) Venn diagrams comparing the transcription factors differentially expressed in HaCaT and TIGK at 6 or 24 h versus 0 h.
FIGURE 8
FIGURE 8
TIGK exhibits enhanced migratory capacity but not proliferative capacity over HaCaT when grown on different ECM proteins. Heatmap of differentially expressed (A) MMPs and (B) integrins between HaCaT and TIGK at unwounded baseline (0 h). Each column of the heatmap represents an independent sample. Representative photographs of in vitro vertical HaCaT and TIGK wounds closing on (C) collagen I, (D) collagen IV, and (E) laminin‐coated plates after one × one cross‐scratching. A black line outlines areas not covered by cells. Rate of HaCaT and TIGK cell migration on (F) collagen I, (G) collagen IV, and (H) laminin‐coated plates, expressed as a percentage of wound closed at each time point. N = 6. Proliferation of HaCaT and TIGK at 48 and 96 h post‐seeding onto (I) collagen I, (J) collagen IV, and (K) laminin‐coated plates was assessed by MTS assay. N = 4, with each dot representing a biological replicate that consists of 2 technical replicates. Bars indicate mean ± SD for all graphs. *p < 0.05, **p < 0.0001. Two‐way ANOVA with a two‐stage linear step‐up procedure of Benjamini, Krieger, and Yekutielipost hoc testing (vs. HaCaT).
FIGURE 9
FIGURE 9
TIGK secretome enhances HaCaT and NHEK migration, but not proliferation. (A) Venn diagram comparing the secretome genes differentially upregulated in HaCaT and TIGK at 24 versus 0 h. (B) Top 10 significantly enriched gene ontology biological process (GO BP) terms enriched for the secretome genes differentially upregulated in TIGK at 24 versus 0 h. (C) Representative photographs of in vitro vertical wounds in HaCaT treated with TIGK conditioned media (T‐CM) after one × one cross‐scratching. A black line outlines areas not covered by cells. (D) Rate of cell migration for HaCaT treated with T‐CM, expressed as a percentage of wound closed. N = 6. (E) Proliferation of HaCaT treated with T‐CM at 48 and 96 h post‐seeding was assessed by MTS assay. N = 3, with each dot representing a biological replicate that consists of 3 technical replicates. (F) Representative photographs of in vitro vertical wounds in NHEK treated with TIGK conditioned media (T‐CM) after one × one cross‐scratching. A black line outlines areas not covered by cells. (G) Rate of cell migration for NHEK treated with T‐CM, expressed as a percentage of wound closed. N = 6. (H) Proliferation of NHEK treated with T‐CM at 48 and 96 h post‐seeding was assessed by MTS assay. N = 3, with each dot representing a biological replicate that consists of 3 technical replicates. Bars indicate mean ± SD for all graphs. *p < 0.05, **p < 0.01, ***p < 0.001. Two‐way ANOVA with a two‐stage linear step‐up procedure of Benjamini, Krieger, and Yekutielipost hoc testing (vs. HaCaT or vs. NHEK).

Similar articles

References

    1. Gushiken L. F. S., Beserra F. P., Bastos J. K., Jackson C. J., and Pellizzon C. H., “Cutaneous Wound Healing: An Update From Physiopathology to Current Therapies,” Lifestyles 11 (2021): 665. - PMC - PubMed
    1. Szpaderska A. M., Zuckerman J. D., and DiPietro L. A., “Differential Injury Responses in Oral Mucosal and Cutaneous Wounds,” Journal of Dental Research 82 (2003): 621–626. - PubMed
    1. Szpaderska A. M., Walsh C. G., Steinberg M. J., and DiPietro L. A., “Distinct Patterns of Angiogenesis in Oral and Skin Wounds,” Journal of Dental Research 84 (2005): 309–314. - PubMed
    1. Chen L., Arbieva Z. H., Guo S., Marucha P. T., Mustoe T. A., and DiPietro L. A., “Positional Differences in the Wound Transcriptome of Skin and Oral Mucosa,” BMC Genomics 11 (2010): 471. - PMC - PubMed
    1. Turabelidze A., Guo S., Chung A. Y., et al., “Intrinsic Differences Between Oral and Skin Keratinocytes,” PLoS One 9 (2014): e101480. - PMC - PubMed

LinkOut - more resources