. 2025 Jun 17;135(16):e177430.
doi: 10.1172/JCI177430. eCollection 2025 Aug 15.

Neuraminidase 1 secondary deficiency contributes to CNS pathology in neurological mucopolysaccharidoses via brain protein hypersialylation

Affiliations

Neuraminidase 1 secondary deficiency contributes to CNS pathology in neurological mucopolysaccharidoses via brain protein hypersialylation

TianMeng Xu et al. J Clin Invest. .

Abstract

Mucopolysaccharidoses (MPS) are lysosomal storage diseases caused by defects in catabolism of glycosaminoglycans. MPS I, II, III, and VII, which are associated with lysosomal accumulation of heparan sulphate (HS), manifest with neurological deterioration and currently lack effective treatments. We report that neuraminidase 1 (NEU1) activity is drastically reduced in brain tissues of patients with neurological MPS and mouse models but not in neurological lysosomal disorders without HS storage. Accumulated HS disrupts the lysosomal multienzyme complex of NEU1 with cathepsin A, β-galactosidase (GLB1), and glucosamine-6-sulfate sulfatase (GALNS), leading to NEU1 deficiency and partial GLB1 and GALNS deficiencies in cortical tissues and induced pluripotent stem cell-derived (iPSC-derived) cortical neurons of patients with neurological MPS. Increased sialylation of N-linked glycans in brains of patients with MPS and mice implicated insufficient processing of sialylated glycans, except for polysialic acid. Correction of NEU1 activity in MPS IIIC mice by lentiviral (LV) gene transfer ameliorated previously identified hallmarks of the disease, including memory impairment, behavioral traits, and reduced levels of excitatory synapse markers VGLUT1 and PSD95. Overexpression of NEU1 also restored levels of VGLUT1/PSD95-positive puncta in cortical iPSC-derived MPS IIIA neurons. Our results demonstrate that HS-induced secondary NEU1 deficiency and aberrant sialylation of brain glycoproteins constitute what we believe is a novel pathological pathway in the neurological MPS spectrum crucially contributing to CNS pathology.

Keywords: Genetic diseases; Genetics; Glycobiology; Lysosomes; Neuroscience.


Figures

Figure 1
Figure 1. NEU1 activity is reduced in brain samples of patients with neurological MPS, brain tissues of neurological MPS mouse models and tissues of MPS IIIC mouse models.
(AC) Total β-hexosaminidase activity (A), total acidic neuraminidase activity (B), and NEU1 activity in the presence of a specific NEU3/4 inhibitor, C9-4BPT-DANA (C) in postmortem cortical tissues of patients with neurological MPS I, MPS II, MPS IIIA, MPS IIIC, and MPS IIID and corresponding age-, sex-, and ethnicity-matched control participants (Ctl; Supplemental Table 1). NEU1 activity is reduced in all samples from patients with MPS compared with those of control tissues. (DG) Total neuraminidase (D) and NEU1 (E) activities are reduced in the brain, liver, and lungs of MPS IIIC mice compared with those of WT controls. Total neuraminidase (F) and NEU1 (G) activities are also reduced in the brains of the mouse models of neurological MPS disorders and MPS IVA compared with respective WT littermates, but they are similar to those of WT or are increased in other LSD models. Graphs show individual values and means (± SD) of 3–4 technical replicates (independent measurements of enzymatic activities in the same autopsy sample) per patient (AC) or 3–5 mice (DG). *P < 0.05, **P < 0.01, ***P < 0.001, ****P < 0.0001, determined by ANOVA with Šídák’s post hoc test (AC and F and G) or Tukey’s post hoc test (D and E).
Figure 2
Figure 2. Secondary deficiency of NEU1 in the MPS IIIC mouse brain coincides with HS accumulation.
(A) Total neuraminidase and NEU1 activity in the hippocampus, paleocortex, cerebellum, olfactory bulb (OB), and frontal cortex of 6-month-old WT, Hgsnat-Geo, and HgsnatP304L mice. NEU1 activity is reduced in the hippocampus, paleocortex, cerebellum, and cerebral cortex. (B) Levels of disaccharides produced by enzymatic digestion of HS (ΔDiHS-OS and ΔDiHS-NS), dermatan sulfate (Di 4S), and monosulfated keratan sulfate (KS) were measured by MS/MS in dissected brain regions of WT, HgsnatP304L, and Hgsnat-Geo mice. Individual data and means ± SD (n = 5–6) are shown. *P < 0.05, **P < 0.01, ***P < 0.001, ****P < 0.0001, determined by 1-way ANOVA with Tukey’s post hoc test (A) and 2-way ANOVA with Dunnett’s post hoc test (B).
Figure 3
Figure 3. Reduced levels of NEU1 protein in the MPS IIIC mouse brain coincide with lysosomal storage of HS.
Representative images (A and B) and quantifications (C) of HS and NEU1 immunoreactivity (red) of brain tissues of 6-month-old WT, Hgsnat-Geo, and HgsnatP304L mice co-labeled with antibodies against lysosome-associated membrane protein 2 (LAMP-2; green), and DAPI (blue). HS is increased in the hippocampus, paleocortex, and frontal cortex of MPS IIIC mice compared with WT mice. HgsnatP304L mice, but not Hgsnat-Geo mice, also show an accumulation of HS in the cerebellum. NEU1 is decreased in the hippocampus, paleocortex, and frontal cortex of MPS IIIC mice. Scale bars: 25 μm. Immunoreactivity was evaluated as percentage of total area using ImageJ software. Individual data and means ± SD (n = 5–7) are shown. *P < 0.05, **P < 0.01, ***P < 0.001, ****P < 0.0001, determined by nested 1-way ANOVA with Tukey’s post hoc test.
Figure 4
Figure 4. HS accumulation causes deficiency of NEU1.
(A and B) HS storage is reduced and NEU1 levels increased in MPS IIIC mice treated with intracerebral injections of AAV-TT-HGSNAT vector. Brain sections of 6-month-old WT, untreated Hgsnat-Geo, and Hgsnat-Geo mice treated with AAV-TT-HGSNAT were labeled for (A) HS (red) and lysosome-associated membrane protein 2 (LAMP2; green) or (B) NEU1 (red) and LAMP2 (green). Nuclei were counterstained with DAPI (blue). HS shows a trend toward a decrease and NEU1 is increased in the brains of AAV-TT-HGSNAT–treated Hgsnat-Geo mice. Panels show representative images of the somatosensory cortex taken with a ×40 objective; scale bars: 25 μm. Data on the graphs show individual values and means ± SD (n = 3–5 areas per mouse). (CE) Administration of EHSO to cultured BMDM causes secondary NEU1 deficiency. HS levels in cultured HgsnatP304L BMDMs untreated (C) or treated with 300 μg/mL EHSO (D) were analyzed by immunofluorescence. Panels show representative images labeled for LAMP2 (green) and HS (red). Nuclei were counterstained with DAPI (blue). Scale bars: 25 μm. (E) NEU1 activity is progressively reduced in the BMDMs cultured in the presence of increasing concentrations of EHSO, as indicated. Confocal images were taken using a ×40 objective; scale bars: 25 μm. Data on the graphs show individual data and means ± SD (n = 4). *P < 0.05, **P < 0.01, ***P < 0.001, determined by nested 1-way ANOVA and a Tukey’s post hoc test (A and B), and 2-way ANOVA with a Dunnett’s post hoc test (E).
Figure 5
Figure 5. NEU1 deficiency in tissues and cells with lysosomal storage of HS is associated with the disruption of the LMC.
(A) Neu1 mRNA measured by quantitative RT-PCR and normalized for Rpl32 expression. (B) Neu1, Neu3, and Neu4 (relative to WT mice) expression measured in the hippocampi by total mRNA sequencing (14). (C) GLB1 activity is reduced in cortical tissues from patients with MPS I (561), MPS II (902), MPS IIIA (3617 and 563), MPS IIIC (6194), and MPS IIID (5411 and 5424), compared with corresponding controls; numbers in parentheses refer to identity of neurological MPS patients in Supplemental Table 1. (D) GALNS activity is reduced in samples from patients with MPS compared with control samples. (E) GALNS activity is reduced in brains of MPS IIIC mice compared with WT mice. (F) NEU1, but not GLB1 or GALNS, is deficient in the brains of galactosialidosis CathAS190A-neo mice. (G and H) CTSA activity in brain samples of patients with MPS (G) and MPS IIIC mice (H) is similar or higher than that of controls. (I) Reduced NEU1 and unchanged CTSA protein levels in MPS IIIA-IIIC mouse brains compared with WT. (J) The gel-filtration profiles of total protein extracts from brain tissues of MPS IIIC HgsnatP304L, WT, and CathAS190A-Neo mice and GLB1 and NEU1 activities in the eluted fractions. (K) HS inhibits NEU1 activity in vitro. Purified recombinant NEU1 was incubated with or without CTSA and HS, followed by NEU1 enzymatic activity (moles of substrate/moles of NEU1/sec) measurement. Insert shows expanded view of the results obtained with the NEU1 apo form. (L) Docked pose of an HS tetramer in the active site of NEU1 (8DU5). The arginine triad of NEU1 is able to engage sulfate and carboxylate groups of the ligand. All graphs show individual results and means ± SD; n = 3–5 (mice) or 3 independent measurements (human samples or recombinant enzymes). *P < 0.05, **P < 0.01, ***P < 0.001, ****P < 0.0001, determined by ANOVA with Tukey’s (A, B, E, and H) or Šídák’s (C, D, and G) post hoc tests or t test (F).
Figure 6
Figure 6. MALDI-TOF MS analysis shows increased sialylation of brain proteins in MPS mouse models and patients with MPS.
Sialylation of N-linked glycans of brain glycoproteins from 10-month-old control, HgsnatP304L, and Hgsnat-Geo mice (A); patients with MPS IIIA, IIIC, and IIID, as well as age- and sex-matched control participants (B); a patient with MPS I, as well as an age- and sex-matched control participant (C); and a patient with neurological MPS II, as well as an age- and sex-matched control participant (D) was analyzed by MALDI-TOF MS. All graphs show average relative intensity of MS peaks of glycan species containing 1, 2, or 3 NeuAc residues or of all sialylated glycans. *P < 0.05, **P < 0.01, ***P < 0.001, ****P < 0.0001, determined by 2-way ANOVA with Holm-Šídák’s multiple comparisons test. n = 3–5 (mice) or 1–3 patients per group. Rel., relative.
Figure 7
Figure 7. ELISA and Western blot analyses show reduced polySia-NCAM in the cortex of MPS IIIC mouse models.
(A) PolySia-NCAM levels in lysates of the anterior cortex from 4-month-old WT, Neu1–/–, HgsnatGeo, and HgsnatP304L mice were assessed by sandwich ELISA. Values were normalized to the mean values of the WT controls. For each sample from 1 animal, 4 technical replicates were measured in independent experiments, and individual values with means (± SD) of 3–6 animals per genotype are plotted. (B) Example of Western blot detection with polySia- (800 nm, green, upper panel) and NCAM-specific antibodies (700 nm, red, upper panel) and grayscale image (lower panel). (CF) Densitometric evaluation of polySia-NCAM Western blot signals (C) and the bands characteristic for the polySia-free NCAM-140 and NCAM-180 isoforms (D and E), normalized to the mean values of the WT controls. Values were normalized to the intensities of NCAM-120, the isoform of mature oligodendrocytes, which is not subject to polysialylation in the mouse brain (35). (F). Individual values with means (± SD) of 3–6 animals per genotype are plotted.
Figure 8
Figure 8. Overexpression of NEU1 and CTSA rescues deficient NEU1, GLB1, and GALNS activities and reduced levels of glutamatergic synapses in human cortical iPSC-derived MPS IIIA neurons.
(A) NEU1, GLB1, and GALNS activities are markedly reduced in cultured iPSC-derived cortical neurons of patients with MPS IIIA, IIIB, and IIIC compared with cells from 2 healthy control participants (CNT-1 and CNT-2). Normal levels of NEU1, GLB1, and GALNS activities are restored in MPS IIIA cells transduced with LV-CTSA-IRES-NEU1-GFP but not with LV-GFP. The graphs show individual data and means ± SD (n = 3), with significance determined by ANOVA with Dunnett’s post hoc test. (B) MPS IIIA iPSC–derived neurons show increased labeling with MAL II lectin compared with control cells, consistent with increased surface sialylation. The labeling is reduced in the MPS IIIA cells transduced with LV-CTSA-IRES-NEU1-GFP but not with LV-GFP. (C) Sialylation of N-linked glycans of cultured neurons analyzed by MALDI-TOF MS is increased in MPS IIIA cells transduced with LV-GFP and decreased in cells transduced with LV-CTSA-IRES-NEU1-GFP. Graphs show average relative intensity of MS peaks of glycan species (Supplemental Table 2) containing 1, 2, or 3 NeuAc residues. n = 5. P values were calculated by 2-way ANOVA with Holm-Šídák’s multiple comparisons test. (D) MPS IIIA iPSC–derived neurons have lower densities of PSD-95+ puncta in juxtaposition with VGLUT1+ puncta compared with control cells, revealing the decrease in the number of functional synapses. The density is increased in LV-CTSA-IRES-NEU1-GFP–transduced but not in LV-GFP–transduced MPS IIIA cells. The amount of BDNF+ puncta (red) is reduced in nontransduced MPS IIIA neurons or those transduced with LV-GFP and LV-CTSA-IRES-NEU1-GFP compared with the control. Scale bars: 10 μm. Fluorescent areas were quantified by ImageJ software. Puncta were counted manually along the axon at 30 μm increments starting 10 μm from the soma and averaged to 10 μm. Graphs show individual data (n = 9–15) and means ± SD, with significance determined by 1-way ANOVA and a Dunnett’s post hoc test.
Figure 9
Figure 9. HgsnatP304L mice treated with LV-CTSA-IRES-NEU1-GFP show a partial rescue of behavior abnormalities.
(A) Improvement of the short-term memory in HgsnatP304L mice injected with LV-CTSA-IRES-NEU1-GFP. Discrimination index and the percentage of time spent exploring the novel object were measured using the NOR test in 6-month-old WT mice, WT mice injected with LV-CTSA-IRES-NEU1-GFP, HgsnatP304L mice, and HgsnatP304L mice injected with LV-CTSA-IRES-NEU1-GFP or LV-GFP. HgsnatP304L mice injected with LV-CTSA-IRES-NEU1-GFP had a higher discrimination index and more time spent with the new object than did control or sham-treated HgsnatP304L mice. (B) HgsnatP304L mice injected with LV-CTSA-IRES-NEU1-GFP show normalization of anxiety as revealed by the OF test. Graphs show the percentage of time spent in the center of the arena, the percentage of the distance traveled in the center zone, and the number of entries to the center of the arena. All graphs show individual data and means ± SD (n = 6–11). **P < 0.01, ***P < 0.001, ****P < 0.0001, determined by 1-way ANOVA with a Tukey’s post hoc test.
Figure 10
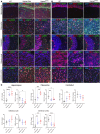
Figure 10. Levels of protein markers of glutamatergic synapse are increased in the brains of HgsnatP304L mice injected with LV-CTSA-IRES-NEU1-GFP.
Representative confocal images and quantification of fluorescence in 4 regions of the hippocampus of WT mice, WT mice injected with LV-CTSA-IRES-NEU1-GFP (LV-NEU1), HgsnatP304L mice, HgsnatP304L mice injected with LV-GFP, and HgsnatP304L mice injected with LV-CTSA-IRES-NEU1-GFP. The sections were labeled for PSD-95 (red) and VGLUT1 (far red/pseudo green) or for Syn1 (red), as indicated. The nuclei were counterstained with DAPI (blue). Quantification of images demonstrates that LV-CTSA-IRES-NEU1-GFP treatment increases the levels of both PSD-95 and VGLUT1 in HgsnatP304L mice, whereas Syn1 shows a nonsignificant trend for an increase. Scale bars: 50 and 10 μm. Data on the graphs show individual results and means (± SD) (n = 5). **P < 0.01, ***P < 0.001, ****P < 0.0001, determined by 1-way ANOVA with Tukey’s post hoc test.

Update of

Similar articles

Cited by

References

    1. Neufeld EF, Muenzer J. The Mucopolysaccharidoses. In Beaudet AL, eds. The Online Metabolic and Molecular Bases of Inherited Disease. McGraw Hill; 2014.
    1. Heon-Roberts R, et al. Molecular bases of neurodegeneration and cognitive decline, the major burden of Sanfilippo Disease. J Clin Med. 2020;9(2):344. doi: 10.3390/jcm9020344. - DOI - PMC - PubMed
    1. Hamano K, et al. Mechanisms of neurodegeneration in mucopolysaccharidoses II and IIIB: analysis of human brain tissue. Acta Neuropathol. 2008;115(5):547–559. doi: 10.1007/s00401-007-0325-3. - DOI - PubMed
    1. Martins C, et al. Neuroinflammation, mitochondrial defects and neurodegeneration in mucopolysaccharidosis III type C mouse model. Brain. 2015;138(pt 2):336–355. doi: 10.1093/brain/awu355. - DOI - PMC - PubMed
    1. Ohmi K, et al. Sanfilippo syndrome type B, a lysosomal storage disease, is also a tauopathy. Proc Natl Acad Sci U S A. 2009;106(20):8332–8337. doi: 10.1073/pnas.0903223106. - DOI - PMC - PubMed

MeSH terms

Supplementary concepts

LinkOut - more resources