. 2025 Jun 20;135(15):e177123.
doi: 10.1172/JCI177123. eCollection 2025 Aug 1.

Angiopoietin-like protein 2 mediates vasculopathy-driven fibrogenesis in a mouse model of systemic sclerosis

Affiliations

Angiopoietin-like protein 2 mediates vasculopathy-driven fibrogenesis in a mouse model of systemic sclerosis

Dyuti Saha et al. J Clin Invest. .

Abstract

Vasculopathy is a common hallmark of various fibrotic disorders, including systemic sclerosis (SSc), yet its underlying etiology and contribution to fibrogenesis remain ill defined. In SSc, the vasculopathy typically precedes the onset of fibrosis, and we observed that this phenomenon is recapitulated in the Snail transgenic mouse model of SSc. The vascular anomalies manifest as deformed vessels, endothelial cell dysfunction, and vascular leakage. Our investigation into the underlying mechanism of this phenotype revealed that angiopoietin-like protein 2 (ANGPTL2), secreted by the Snail transgenic keratinocytes, is a principal driver of fibrotic vasculopathy. In endothelial cells, ANGPTL2 upregulates profibrotic genes, downregulates various junctional proteins, and prompts the acquisition of mesenchymal characteristics. Inhibiting endothelial cell junctional instability and, consequently, vascular leakage with a synthetic analog of the microbial metabolite Urolithin A (UAS03) effectively mitigated the vasculopathy and inhibited fibrogenesis. Thus, ANGPTL2 is a promising early biomarker of the disease, and inhibiting the vasculopathy-inducing effects of this protein with agents such as UAS03 presents an appealing therapeutic avenue to reduce disease severity. These insights hold the potential to revolutionize the approach to treatment of fibrotic diseases by targeting vascular defects.

Keywords: Cell biology; Dermatology; Endothelial cells; Fibrosis; Skin; Vascular biology.


Conflict of interest statement

Conflict of interest: The authors have declared that no conflict of interest exists.

Figures

Figure 1
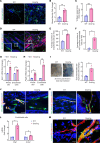
Figure 1. Adult Snail-tg skin recapitulates vasculature abnormalities observed in SSc.
(A) WT and Snail-tg skin stained for PECAM1 (green). Dilated regions of vessels are denoted with a pound symbol. Quantification of (B) vessel density and (C) mean vessel area in WT and Snail-tg skin. (D) WT and Snail-tg skin stained for PECAM1 (green) and proliferation marker Ki67 (red). Arrows mark PECAM1+/Ki67+ cells. Insets show magnified endothelial cells. Number of (E) endothelial cells and (F) PECAM1+/Ki67+ cells in WT and Snail-tg skin. qPCR analysis of (G) Edn1 mRNA and (H) Pdgfb mRNA in whole skin and isolated dermal endothelial cells in WT and Snail-tg mice. (I) Evans blue dye leakage assay and quantification. WT and Snail-tg skin stained for (J) Claudin5 (red)/PECAM1 (green) and (K) VE-Cadherin (red)/PECAM1(green). (L) qPCR analysis of myofibroblast markers (Ctgf and Acta2) in isolated dermal endothelial cells from WT and Snail-tg mice skin. (M) WT and Snail-tg skin stained for α-SMA (green) and PECAM1 (red). Arrow marks α-SMA+/PECAM1+ vascular structure. Nuclei are marked in blue. Scale bars: 50 μm (A and D), 20 μm (J and K), 10 μm (M). Data are shown as mean ± SEM; P values were calculated using unpaired Welch’s t test for whole skin data and paired Student’s t test for endothelial cell data. *P < 0.05, **P < 0.01, ***P < 0.001. All experiments are n = 3 biological replicates. Three fields of interest (FOIs) were analyzed per biological replicate for quantification of images.
Figure 2
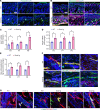
Figure 2. Vasculopathy phenotype occurs early in fibrogenesis.
The skin from P3, P7, and P9 WT and Snail-tg mice was stained for (A) PECAM1 (green) and for (B) PECAM1 (green) and Ki67 (red). Dilated regions are marked by a pound symbol, and arrows mark PECAM1+/Ki67+ cells. qPCR analysis of (C) Edn1 mRNA and (D) Pdgfb mRNA in whole skin in WT and Snail-tg mice. (E) Quantification of Evans blue dye leakage assay. WT and Snail-tg skin stained for (F) claudin5 (red) and PECAM1 (green) and for (G) α-SMA (green) and PECAM1 (red). Arrow marks α-SMA/PECAM1 double-positive vascular structures. Nuclei are marked in blue. Scale bars: 100 μm (A and B), 20 μm (F and G). Data are shown as mean ± SEM; P values were calculated using unpaired Welch’s t test. *P < 0.05. All experiments are n = 3 biological replicates.
Figure 3
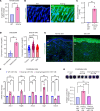
Figure 3. ANGPTL2 is necessary for fibrotic vasculopathy.
(A) qPCR of Angptl2 mRNA in WT and Snail-tg mouse keratinocytes (mKT). (B) Secreted ANGPTL2 (in green) in WT and Snail-tg skin at P3. The dotted line denotes the basement membrane separating the epidermis (epi) from the underlying dermis (der). (C) ELISA for secreted ANGPTL2 in WT and Snail-tg mKT conditioned media (CM). (D) Expression of Angptl2 in keloid lesion skin (n = 3) compared with nonlesion skin (n = 3) (from GSE92566) and in healthy (n = 44) compared with affected forearm skin from diffuse (n = 180) and localized SSc (n = 115) patients (from GSE181549). The expression values are from the GEO2R algorithm’s output. (E) Secreted ANGPTL2 (in green) in normal and SSc skin. Representative of n = 5 SSc samples and normal skin controls. (F) qPCR of vasculopathy and endoMT-related genes in SVEC4-10 endothelial cells treated with WT, Snail-tg, and Snail-tg/Angptl2-KO mKT conditioned media. (G) Quantification of collagen contraction assay in SVEC4-10 endothelial cells treated with WT, Snail-tg, and Snail-tg/Angptl2-KO mKT conditioned media. Nuclei are marked in blue. Scale bars: 50 μm. Data are shown as mean ± SEM; P values were calculated using paired Student’s t test (A), unpaired Welch’s t test (D), and 1-way ANOVA followed by Tukey’s post hoc analysis (F and G). *P < 0.05, **P < 0.01, ****P < 0.0001, NS > 0.05. All experiments except (D and E) are n = 3 biological replicates.
Figure 4
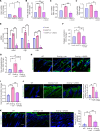
Figure 4. ANGPTL2 is required for development of vasculopathy and fibrosis in Snail-tg skin.
(A) PECAM1 (green) staining, (B) quantification of vessel density, (C) quantification of vessel area, (D) quantification of Evans blue dye leakage assay, (E) collagen I staining (green) and (F) quantification, and (G) H&E staining and (H) quantification of dermal thickness in WT, Snail-tg, and Snail-tg/Angptl2-KO mouse at P60. Scale bars: 50 μm (A and E), 100 μm (G). Nuclei are marked in blue. Data are shown as mean ± SEM: P values were calculated using 1-way ANOVA followed by Tukey’s post hoc analysis for multiple group comparisons. *P < 0.05, **P < 0.01, ***P < 0.001, ****P < 0.0001, NS > 0.05. All experiments are n = 3 biological replicates. Three FOIs were analyzed per biological replicate for quantification of images.
Figure 5
Figure 5. ANGPTL2 is sufficient to drive vasculopathy.
(A) PECAM1 (green) staining in control and ANGPTL2-treated skin explants. The pound symbols denote dilated regions. Nuclei are marked in blue. qPCR analysis of mRNA levels of (B) Edn1 and (C) Pdgfb in control and ANGPTL2-treated skin explants and SVEC4-10 cells. (D) qPCR analysis of mRNA levels of myofibroblast markers (Acta2 and Ctgf). (E) Collagen contraction assay (left panel) and quantification (right panel) using dermal fibroblasts treated with conditioned media from control and ANGPTL2-treated SVEC4-10 cells. (F) qPCR analysis of mRNA levels of myofibroblasts markers (Acta2, Ctgf, Fsp1, SM22a, and Cnn1) in control and ANGPTL2-treated SVEC4-10. (G) Collagen contraction assay (left panel) and quantification (right panel) for control and ANGPTL2-treated SVEC4-10. (H) Quantification of in vitro vascular permeability assay. (I) qPCR analysis of mRNA levels of Cldn5 in control and ANGPTL2-treated SVEC4-10. (J) Quantification of collagen contraction assay in SVEC4-10 + control, SVEC4-10 + ANGPTL2, and claudin5-overexpressed SVEC4-10 (SVEC4-10-C5) + ANGPTL2. Scale bar: 50 μm. Data are shown as mean ± SEM; P values were calculated using paired Student’s t test (BI) and 1-way ANOVA followed by Tukey’s post hoc analysis (J). *P < 0.05, **P < 0.01. All experiments are n = 3 biological replicates.
Figure 6
Figure 6. ANGPTL2-driven vasculopathy is mediated by the integrin α5β1/β-catenin pathway.
(A) qPCR analysis of mRNA levels of vasculopathy and endoMT-related genes and (B) collagen contraction assay quantification in SVEC4-10 cells treated with control, ANGPTL2, and ANGPTL2 + ATN-161. (C) Staining for β-catenin (green) in control or ANGPTL2-treated SVEC4-10 cells. (D) qPCR analysis of mRNA levels of vasculopathy and endoMT-related genes and (E) collagen contraction assay quantification in SVEC4-10 cells treated with control, ANGPTL2, and ANGPTL2 + XAV-939. Scale bar: 10 μm. Data are shown as mean ± SEM; P values were calculated using 1-way ANOVA followed by Tukey’s post hoc analysis for multiple group comparisons. *P < 0.05, **P < 0.01, ***P < 0.001, NS > 0.05. All experiments are n = 3 biological replicates.
Figure 7
Figure 7. UAS03 abrogates effects of ANGPTL2 on endothelial cells and counteracts fibrosis.
SVEC4-10 cells were treated with control, ANGPTL2, or ANGPTL2 + UAS03 and processed for qPCR of Cldn5 mRNA (A), in vitro vascular permeability (B), qPCR of Edn1 mRNA (C), qPCR of Pdgfb mRNA (D), expression of myofibroblast markers (Acta2, Ctgf, and Fsp1) (E), and collagen contraction activity (F). (G) Quantification of Evans blue dye leakage assay. (H) Staining for PECAM1 (green) and nuclei (DAPI) at P60 in WT, Snail-tg + vehicle control (veh), and Snail-tg + UAS03 injected mice. (I) Quantification of dermal thickness at P60 in WT, Snail-tg + veh, and Snail-tg + UAS03. (J) Staining for collagen I (green) and quantification at P60 in WT, Snail-tg + veh, and Snail-tg + UAS03. (K) Staining for CD11b+ cells (green) and nuclei (blue) and quantification at P9 in WT, Snail-tg + veh, and Snail-tg + UAS03. Scale bars: 100 μm (H and J), 50 μm (K). Data are shown as mean ± SEM; P values were calculated using paired Student’s t test for (AF) and 1-way ANOVA followed by Tukey’s post hoc analysis for multiple group comparisons for (G and IK). *P < 0.05, **P < 0.01, ***P < 0.001, NS > 0.05. All experiments are n = 3 biological replicates. Three FOIs were analyzed per biological replicate for quantification of images.
Figure 8
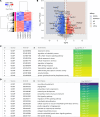
Figure 8. RNA-Seq analysis of UAS03-treated endothelial cells.
SVEC4-10 cells were treated with control or 50 μM UAS03, total RNA was isolated, and RNA-Seq was performed as described in Methods. (A) Heat map of differentially expressed genes generated using the heatmap.2 function in the gplots package. Genes with q value of less than 0.05 and fold change (FC) greater than1.5 or less than –1.5 were clustered using the hclust function using Pearson’s method for genes and Spearman’s method for samples. (B) Volcano plot of differentially expressed genes created using ggplot. Downregulated genes are represented as blue dots (q < 0.05, FC < –1.5) and light blue dots (q < 0.05, FC < 0, FC > –1.5). Upregulated genes are represented as red dots (q < 0.05, FC > 1.5) and gold dots (q < 0.05, FC > 0, FC < –1.5). The following genes are highlighted: top 3 significant differentially expressed genes, top 3 upregulated and downregulated genes with maximum fold change, and genes of interest based on the in vivo observations with UAS03 treatment. GO term enrichment analysis from the list of significantly upregulated (C) and downregulated (D) genes using gProfiler2. Terms of interest from “molecular function” and “biological pathway” categories are depicted based on the in vivo observations with UAS03 treatment. n = 3 biological replicates.
Figure 9
Figure 9. Model demonstrating vasculopathy-mediated fibrosis driven by ANGPTL2 in Snail-tg skin is counteracted by UAS03.

References

    1. Wynn TA. Common and unique mechanisms regulate fibrosis in various fibroproliferative diseases. J Clin Invest. 2007;117(3):524–529. doi: 10.1172/JCI31487. - DOI - PMC - PubMed
    1. Frangogiannis NG. Transforming growth factor–β in tissue fibrosis. J Exp Med. 2020;217(3):e20190103. doi: 10.1084/jem.20190103. - DOI - PMC - PubMed
    1. Huang E, et al. The roles of immune cells in the pathogenesis of fibrosis. Int J Mol Sci. 2020;21(15):5203. doi: 10.3390/ijms21155203. - DOI - PMC - PubMed
    1. Connolly MK. Systemic sclerosis (scleroderma): remaining challenges. Ann Transl Med. 2021;9(5):438. doi: 10.21037/atm-20-5449. - DOI - PMC - PubMed
    1. Careta MF, Romiti R. Localized scleroderma: clinical spectrum and therapeutic update. An Bras Dermatol. 2015;90(1):62–73. doi: 10.1590/abd1806-4841.20152890. - DOI - PMC - PubMed