. 2025 Jun 20;20(6):e0326577.
doi: 10.1371/journal.pone.0326577. eCollection 2025.

Efficient endogenous protein labelling in Dictyostelium using CRISPR/Cas9 knock-in and split fluorescent proteins

Affiliations

Efficient endogenous protein labelling in Dictyostelium using CRISPR/Cas9 knock-in and split fluorescent proteins

Kensuke Yamashita et al. PLoS One. .

Abstract

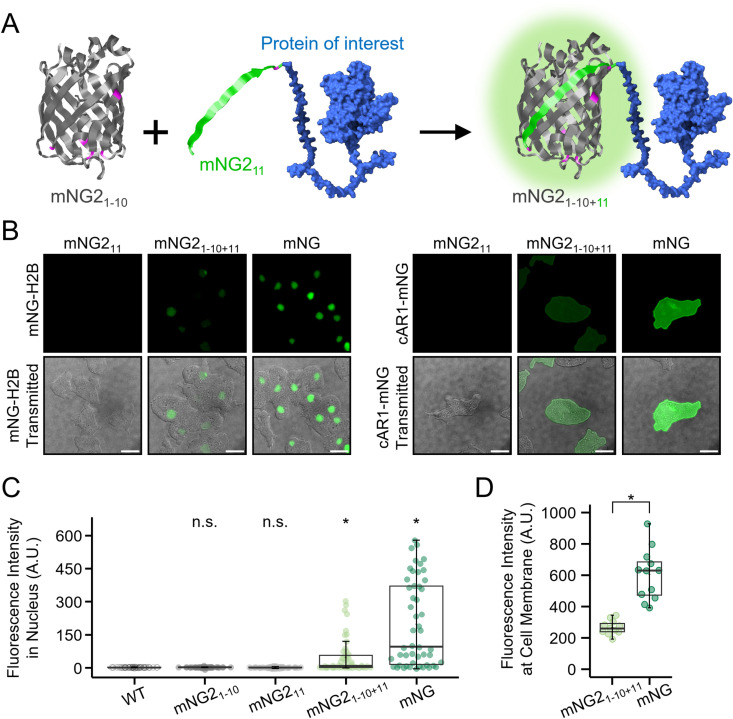
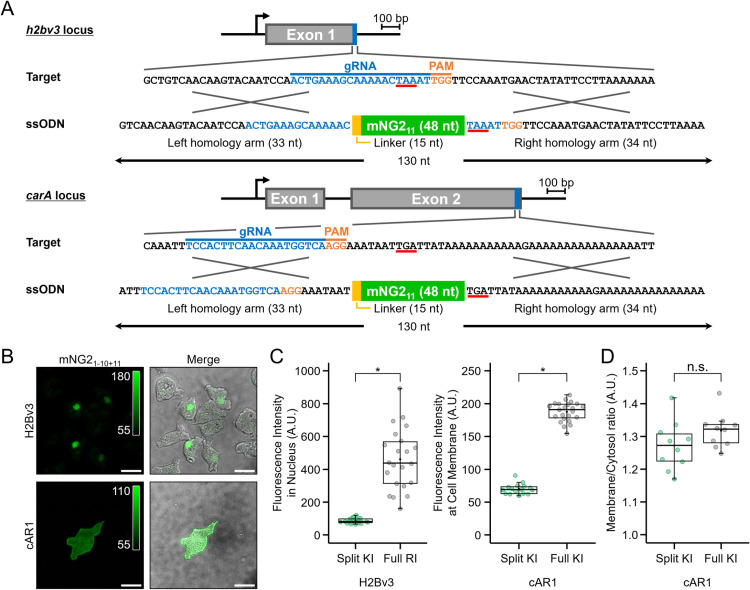
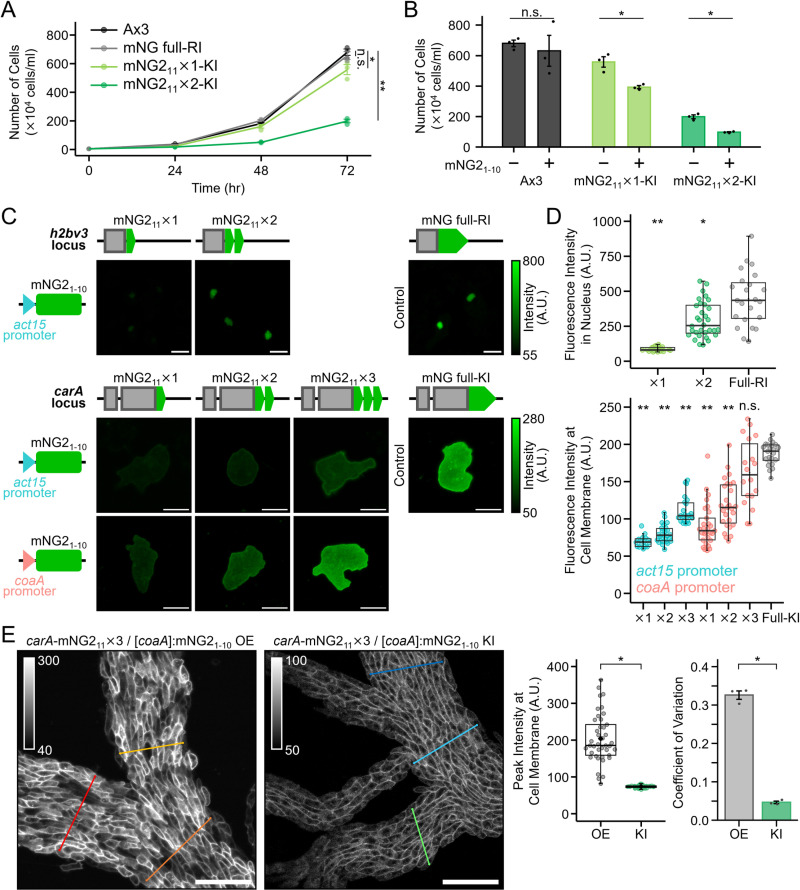
Fluorescent protein tagging is a powerful technique for visualising protein dynamics; however, full-length fluorescent protein knock-in can be inefficient at certain genomic loci, making it challenging to achieve stable and uniform expression. To address this issue, we used CRISPR/Cas9-mediated knock-in strategies with split fluorescent proteins in Dictyostelium discoideum. This approach enabled efficient integration of the short mNeonGreen2 (mNG2) fragment, mNG211, particularly at functionally critical loci such as major histone h2bv3, where full-length tagging was unsuccessful. Our analysis revealed that inserting tandem repeats of mNG211 at the h2bv3 locus progressively impaired cell proliferation, indicating that functional disruption depends on insert size. These findings suggest that using short tags like mNG211 minimises functional interference and facilitates knock-in at sensitive loci. We further optimised the fluorescence intensity by fine-tuning the expression of the long fragment, mNG21-10, and introducing tandem repeats of mNG211. This approach provides a reliable method for precise and stable endogenous protein labelling, facilitating live-cell imaging and functional studies in D. discoideum.


Conflict of interest statement

The authors have declared that no competing interests exist.

Figures

Fig 1
Fig 1. Analysis of mNG-GtaC fusion protein dynamics in knock-in and overexpressing cells.
(A) Visualisation of mNG-GtaC dynamics during the aggregation stage. Images were taken every 30 s starting at 5 h after starvation. The upper panels show cells with mNG knock-in at the gtaC locus, while the lower panels depict cells overexpressing mNG-GtaC from a plasmid. Grayscale images represent fluorescence from mNG signals, and colour images display merged mNG and mCherry channels, using cells in which the nucleus was labelled with histone mCherry-H2Bv3. Nuclear mCherry-H2Bv3 expression was achieved by knock-in of the [act15]:mCherry-H2Bv3 cassette at the cinD locus. Fluorescence intensity in the grayscale images is indicated by the colour key. Time is in min:sec. Scale bars: 20 µm. (B) Nuclear-to-cytoplasmic (N/C) ratio of mNG-GtaC after 5 h of development. Data represent individual measurements from 60 cells, with the mean value indicated. (C) Differences in multicellular formation between knock-in (KI) and overexpressing (OE) cells. Scale bars: 0.5 mm. (D) Comparison of aggregate formation in knock-in and overexpressing cells at 7 h of development. n = 48, 38, 17 images. n.s., p > 0.05, *p < 0.001; The Kruskal–Wallis test followed by Steel’s post hoc test.
Fig 2
Fig 2. Knock-in of full-length fluorescent tags for visualisation of endogenous proteins.
(A) Schematic representation of knock-in targeting at the carA and h2bv3 loci using a full-length fluorescent tag. Expanded C-terminal sequences of the target genes are shown, with the gRNA indicated in blue, PAM sequence highlighted in orange, and stop codon marked in red. (B) Plasma membrane fluorescence of cAR1 during early developmental stages. Scale bars: 50 µm. (C) Nuclear labelling of H2Bv3 and monitoring of the mitotic process. Arrowheads indicate dividing cells, as evidenced by the dynamic redistribution of nuclear fluorescence. Time is in min:sec. Scale bars: 10 µm. (D) Representative images of mNG fluorescence in (wild-type [WT]; no fluorescence), a randomly integrated H2Bv3-labelled clone (RI), and mNG-fused H2Bv3 knocked in at the cinD locus (KI) under the control of a constitutive promoter. Upper panels show mNG fluorescence alone, whereas lower panels display merged mNG and DAPI signals. All nuclei within the field are visualised by DAPI staining. Scale bars: 10 µm.
Fig 3
Fig 3. Analysis of fluorescence intensity and cellular localisation of split-mNG2.
(A) Schematic representation of the split-mNG2 system, showing the separation of mNG21-10 and mNG211 fragments. (B) Comparison of split and full-length fluorescent proteins fused to H2Bv3 and cAR1. Cells expressing only the short fragment (mNG211), both fragments (mNG21-10 + mNG211), or full-length mNG (mNG) were analysed. H2B-expressing cells were observed immediately after starvation condition, whereas cAR1-expressing cells were observed at 7 h of development. Scale bars: 10 µm. (C) Comparison of fluorescence intensity between split-mNG2 and full-length mNG. Nuclei were stained with DAPI, and green fluorescence signals were measured within the DAPI-defined nuclear region. Fluorescence intensities were measured after background subtraction using the average signal from a cell-free area. n = 50, n.s., p > 0.05, *p < 0.001; The Kruskal–Wallis test followed by Steel’s post hoc test. (D) Quantification of plasma membrane fluorescence intensity in live cAR1-mNG-expressing cells. Mean fluorescence intensity was measured and compared between the split-mNG2 and full-length mNG. n = 11 for mNG21-10+11; 12 for mNG. *p < 0.001; Welch’s t-test.
Fig 4
Fig 4. Visualisation of endogenous proteins through the knock-in of split mNG211.
(A) C-terminal sequences of the knock-in target loci and ssODNs used as knock-in donors. The genomic sequences of h2bv3 and carA are shown, with the gRNA indicated in blue, PAM sequence highlighted in orange, and the stop codon underlined in red. The knock-in donor consists of a 130-nt ssODN, containing a homologous left arm, right arm, linker, and mNG211. The short fragment, mNG211, was knocked into the target gene, whereas the long fragment, mNG21-10, was stably expressed from a plasmid under control of the act15 promoter. (B) Fluorescence images of knock-in clones. mNG21-10 was overexpressed from an expression vector. Cells expressing H2Bv3-mNG2 were imaged immediately after starvation, whereas cells expressing cAR1-mNG2 were imaged at 7 h of development. Scale bars: 10 µm. (C) Comparison of fluorescence intensity between split mNG2 and full-length mNG. Full-length mNG was tagged at the C-terminus of H2Bv3 (random integration) and cAR1 (knock-in) and used as a control for fluorescence intensity comparison. H2Bv3 (n = 21 cells for split, n = 23 cells for full-length), cAR1 (n = 16 cells for split, n = 23 cells for full-length). *p < 0.001; Wilcoxon rank-sum test. (D) Comparison of membrane-to-cytoplasm fluorescence intensity ratios of cAR1 between split mNG2 and full-length mNG (n = 10 cells). n.s., p > 0.05; Wilcoxon rank-sum test.
Fig 5
Fig 5. Enhancement of fluorescence intensity and homogeneity by tandem repeats of split mNG211.
(A) Growth curves of cells with one or two tandem repeats of mNG11 knocked into the h2bv3 locus. Data points represent the mean ± SE of three biological replicates, with individual data points shown. n.s., p > 0.05, *p < 0.05, ***p < 0.001; The Kruskal–Wallis test followed by Dunnet post hoc test between final samples at 72 hours. (B) Effect of mNG2 reconstitution by mNG21-10 expression on the proliferation of h2bv3 knock-in cells with tandem mNG211 repeats. Proliferation at 72 h was compared. n.s., p > 0.05, *p < 0.01; Student’s t-test. (C) Fluorescence images of cells with different numbers of mNG211 repeats knocked into the h2bv3 and carA loci. mNG21-10 was stably expressed from a plasmid under either the act15 or coaA promoter. Images are displayed with brightness corresponding to the colour key. Cells expressing endogenous H2Bv3 or cAR1 were visualised at 0 or 7 h of development, respectively. Scale bars: 10 µm. (D) Comparison of fluorescence intensities across different tandem repeat constructs. The top panel shows H2Bv3 constructs including the full-length mNG expressed from a randomly integrated (RI) locus, whereas the bottom panel shows carA knock-in (KI) constructs (n ≥ 16 cells per condition). The full-length mNG-tagging was used as a practical reference to evaluate the achievable fluorescence intensity of mNG2-based split tags. n.s., p > 0.05, *p < 0.01, **p < 0.001; The Kruskal–Wallis test followed by Steel’s post hoc test. (E) Knock-in of [coaA]:mNG21-10 at the cinD locus improves the heterogeneity of cAR1 fluorescence at the plasma membrane during aggregation. The left graph shows the peak fluorescence intensities measured along the cell membrane, and the right graph displays the coefficient of variation (CV) calculated from these measurements. Scale bars: 50 µm. *p < 0.001; Welch’s t-test.

Similar articles

References

    1. Liss V, Barlag B, Nietschke M, Hensel M. Self-labelling enzymes as universal tags for fluorescence microscopy, super-resolution microscopy and electron microscopy. Sci Rep. 2015;5:17740. doi: 10.1038/srep17740 - DOI - PMC - PubMed
    1. Rodriguez EA, Campbell RE, Lin JY, Lin MZ, Miyawaki A, Palmer AE, et al. The Growing and Glowing Toolbox of Fluorescent and Photoactive Proteins. Trends Biochem Sci. 2017;42(2):111–29. doi: 10.1016/j.tibs.2016.09.010 - DOI - PMC - PubMed
    1. Marchetti A, Lima WC, Hammel P, Cosson P. A quantitative comparison of antibodies against epitope tags for immunofluorescence detection. FEBS Open Bio. 2023;13(12):2239–45. doi: 10.1002/2211-5463.13705 - DOI - PMC - PubMed
    1. Prelich G. Gene overexpression: uses, mechanisms, and interpretation. Genetics. 2012;190(3):841–54. doi: 10.1534/genetics.111.136911 - DOI - PMC - PubMed
    1. Birchler JA, Veitia RA. Gene balance hypothesis: connecting issues of dosage sensitivity across biological disciplines. Proc Natl Acad Sci U S A. 2012;109(37):14746–53. doi: 10.1073/pnas.1207726109 - DOI - PMC - PubMed

MeSH terms

LinkOut - more resources