. 2025 Jun 20;21(6):e1013295.
doi: 10.1371/journal.ppat.1013295. eCollection 2025 Jun.

SARS-CoV-2 remodels the Golgi apparatus to facilitate viral assembly and secretion

Affiliations

SARS-CoV-2 remodels the Golgi apparatus to facilitate viral assembly and secretion

Jianchao Zhang et al. PLoS Pathog. .

Abstract

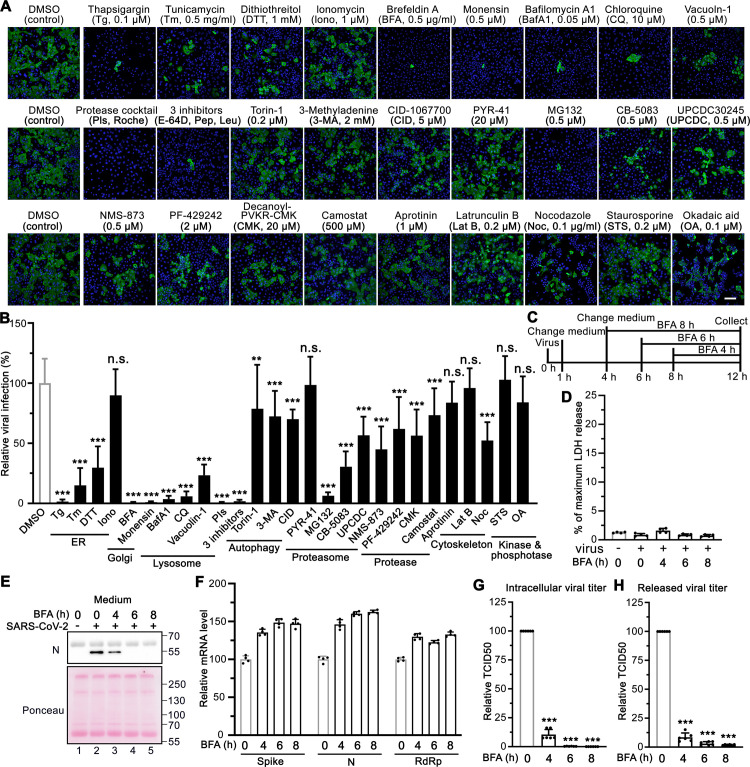
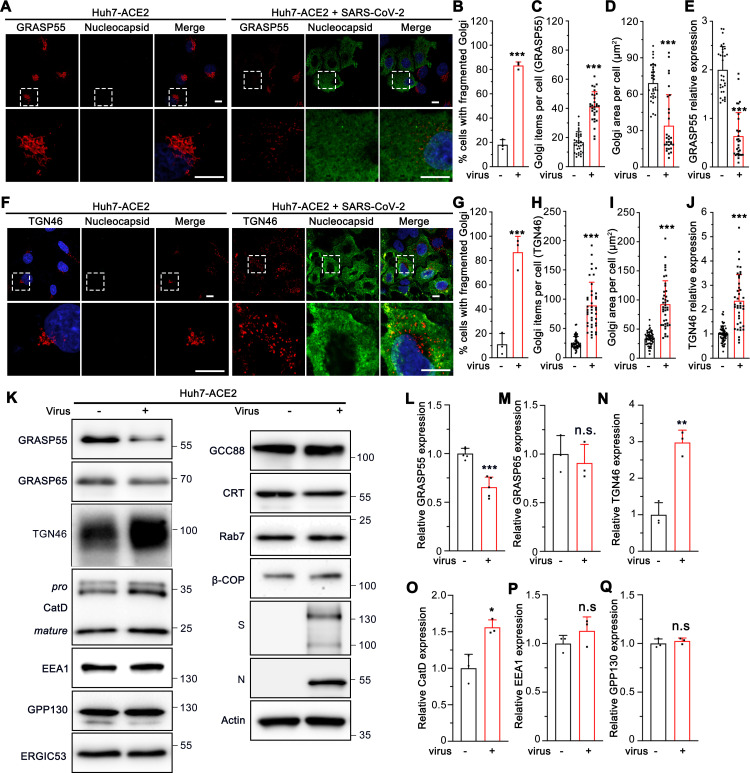
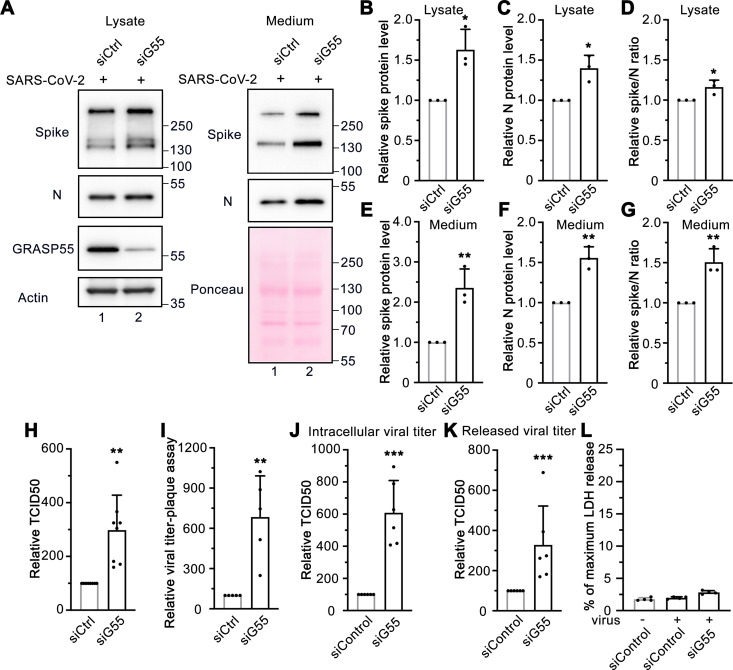
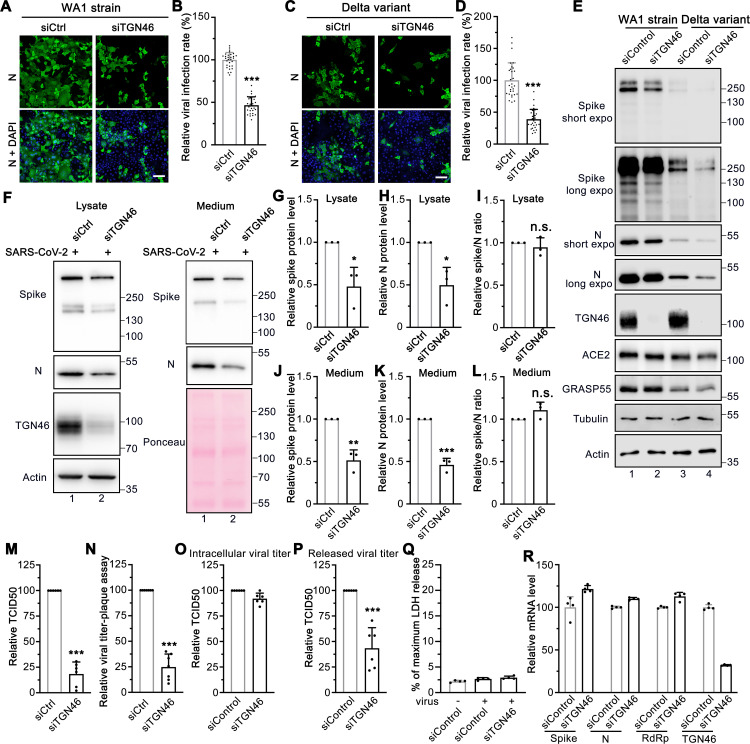
The COVID-19 pandemic is caused by the enveloped virus SARS-CoV-2. Despite extensive investigation, the molecular mechanisms for its assembly and secretion remain largely elusive. Here, we show that SARS-CoV-2 infection induces global alterations of the host endomembrane system, including dramatic Golgi fragmentation. SARS-CoV-2 virions are enriched in the fragmented Golgi. Blocking endoplasmic reticulum (ER) to Golgi trafficking dramatically inhibits SARS-CoV-2 assembly and secretion without reducing viral genome replication. Significantly, SARS-CoV-2 infection down-regulates GRASP55 but up-regulates TGN46 protein levels. Surprisingly, GRASP55 expression reduces both viral secretion and spike number on each virion without affecting viral entry, while GRASP55 depletion displays opposite effects. In contrast, TGN46 depletion only inhibits viral secretion without affecting spike incorporation into virions. Taken together, we show that SARS-CoV-2 alters Golgi structure and function to modulate viral assembly and secretion, highlighting the Golgi as a potential therapeutic target for blocking SARS-CoV-2 infection.


Conflict of interest statement

The authors have declared that no competing interests exist.

Figures

Fig 1
Fig 1. SARS-CoV-2 infection induces global morphological changes of host cell membrane organelles.
(A) Representative confocal images of Huh7-ACE2 cells incubated with or without SARS-CoV-2 (MOI = 1) for 24 h and stained for ERGIC53 and nucleocapsid. (B-D) Quantification of ERGIC53 for the number of puncta (B), area (C), and relative expression (D) in A. (E) Representative confocal images of Huh7-ACE2 cells incubated with or without SARS-CoV-2 (MOI = 1) for 24 h and stained for a cis-Golgi marker GPP130 and nucleocapsid. (F-H) Quantification of GPP130 in E. (I) Representative confocal images of Huh7-ACE2 cells incubated with or without SARS-CoV-2 (MOI = 1) for 24 h and stained for an early endosome marker EEA1 and spike. (J-L) Quantification of EEA1 item number (J), area (K), and relative expression (L) in I. (M) Representative confocal images of Huh7-ACE2 cells incubated with or without SARS-CoV-2 (MOI = 1) for 24 h and stained for a late endosome marker Rab7 and nucleocapsid. (N-P) Quantification of Rab7 in M. (Q) Representative confocal images of Huh7-ACE2 cells incubated with or without SARS-CoV-2 (MOI = 1) for 24 h and stained for a late endosome/lysosome marker LAMP2 and spike. (R-T) Quantification of LAMP2 in Q. Boxed areas in the upper panels are enlarged and shown underneath. Scale bars in all panels, 10 μm. All quantitation data are shown as mean ± SD from three independent experiments. Statistical analyses are performed using two-tailed Student’s t-test. *, p < 0.05; **, p < 0.01; ***, p < 0.001; n.s., not significant.
Fig 2
Fig 2. Chemicals disrupting Golgi functions inhibit SARS-CoV-2 infection.
(A) Representative immunofluorescence images of Huh7-ACE2 cells that were infected with SARS-CoV-2 (MOI = 1) in the presence of indicated chemicals for 24 h and stained for nucleocapsid and DNA. The concentrations of the chemical are shown on the figure or as follows: protease inhibitor cocktails (PIs), 100 ml/tablet; 3 inhibitors, 10 μM E-64D, 20 μM pepstatin, 100 μM leupeptin. Scale bar, 100 μm. (B) Quantification of the viral infection percentage in A, with the control normalized to 100%. Data are shown as mean ± SD from 20-30 random images from two or three independent experiments. Statistical analyses are performed using one-way ANOVA, Tukey’s multiple comparison test. *, p < 0.05; ***, p < 0.001; n.s., not significant. (C) Schematic diagram of the multiple time points for BFA treatment assay. (D) Representative LDH assay of Huh7-ACE2 cells treated with 5 µg/ml BFA for the indicated time points with 4 technical replicates from two independent experiments. (E) Immunoblots of culture media of Huh7-ACE2 cells incubated with or without SARS-CoV-2 (MOI = 5) for 12 h and treated by 5 µg/ml BFA for the indicated time points. (F-H) Representative RT-qPCR assay (F), intracellular viral titer assay (G), and released viral titer assay (H) of Huh7-ACE2 cells treated by 5 µg/ml BFA for the indicated time points with 4 technical replicates from two independent experiments.
Fig 3
Fig 3. SARS-CoV-2 infection dramatically disrupts the Golgi structure.
(A) Representative confocal images of Huh7-ACE2 cells incubated with or without SARS-CoV-2 (MOI = 1) for 24 h and stained for a cis-Golgi marker GRASP65 and nucleocapsid. (B-E) Quantification of A for the percentage of cells with fragmented Golgi (B), GRASP65 punctum number (C), area (D), and relative expression level (E). (F) Representative confocal images of Huh7-ACE2 cells incubated with or without SARS-CoV-2 (MOI = 1) for 24 h and stained for a trans-Golgi marker GalT and nucleocapsid. (G-J) Quantification of GalT in F. (K) Representative confocal images of Huh7-ACE2 cells incubated with or without SARS-CoV-2 (MOI = 1) for 24 h and stained for a TGN marker Golgin-245 and spike. (L-O) Quantification of Golgin-245 in K. Boxed areas in the upper panels of A, F and K are enlarged and shown underneath. Scale bars in all fluorescence images, 10 μm. (P) Electron micrographs of Huh7-ACE2 incubated with or without SARS-CoV-2 (MOI = 1) for 24 h under two different magnifications. Boxed areas on the left images are enlarged on the right. Black arrows, white arrowheads, and black arrowheads indicate Golgi membranes, viral particles, and DMVs, respectively. Scale bars, 500 nm. Data are shown as mean ± SD from three independent experiments. Statistical analyses are performed using two-tailed Student’s t-test. *, p < 0.05; ***, p < 0.001; n.s., not significant.
Fig 4
Fig 4. SARS-CoV-2 down-regulates GRASP55 and up-regulates TGN46 expression in Huh7-ACE2 cells.
(A) SARS-CoV-2 infection reduces GRASP55 expression. Representative confocal images of Huh7-ACE2 cells incubated with or without SARS-CoV-2 (MOI = 1) for 24 h and stained for GRASP55 and nucleocapsid. (B-E) Quantification of the percentage of cells with fragmented Golgi (B), GRASP55 item number (C), area (D), and relative expression level (E) in A. (F) SARS-CoV-2 infection increases TGN46 expression. Representative confocal images of Huh7-ACE2 cells incubated with or without SARS-CoV-2 (MOI = 1) for 24 h and stained for TGN46 and nucleocapsid. (G-J) Quantification of TGN46 in F. Boxed areas in the upper panels of A and F are enlarged and shown underneath. Scale bars, 10 μm. (K) Immunoblots of Huh7-ACE2 cells incubated with or without SARS-CoV-2 (MOI = 2) for 24 h for indicated proteins. (L-Q) Quantification of the relative expression of GRASP55 (L), GRASP65 (M), TGN46 (N), CatD (O), EEA1 (P), and GPP130 (Q). Data are shown as mean ± SD from at least three independent experiments. Statistical analyses are performed using two-tailed Student’s t-test. *, p < 0.05; **, p < 0.01; ***, p < 0.001; n.s., not significant.
Fig 5
Fig 5. Expression of GRASP55 reduces SARS-CoV-2 assembly and secretion.
(A) GRASP55 expression reduces SARS-CoV-2 infection. Huh7-ACE2 cells stably expressing GFP or GRASP55-GFP were infected with SARS-CoV-2 (MOI = 3) for 24 h and stained for nucleocapsid. Shown are representative fluorescence images from 15 random images of one representative replicate from three independent experiments. Scale bars, 100 μm. (B) Quantification of the viral infection percentage in A. (C) Representative LDH assay of Huh7-ACE2 cells stably expressing GFP or GRASP55-GFP infected with SARS-CoV-2 (MOI = 3) for 24 h with 4 technical replicates from two independent experiments. (D) Representative RT-qPCR assay of Huh7-ACE2 cells stably expressing GFP or GRASP55-GFP infected with SARS-CoV-2 (MOI = 5) for 4 h with 4 technical replicates from two independent experiments. (E) Immunoblots of cell lysates and PEG-precipitated culture media of stable Huh7-ACE2 cells expressing GFP or GRASP55-GFP infected with SARS-CoV-2 (MOI = 3) for 24 h for indicated proteins. (F-K) Quantification of the relative expression of spike (F, I), N (G, J), and relative spike/N ratio (H, K) from cell lysates and culture media, respectively. (L-M) TCID50 assay (L) and plaque assay (M) of viruses collected from stable Huh7-ACE2 cells expressing GFP or GRASP55-GFP after SARS-CoV-2 infection (MOI = 3) for 24 h. (N) Proposed working model for a role of GRASP55 in SARS-CoV-2 infection. In brief, under normal conditions (a) GRASP55 is expressed at a high level and maintains the Golgi in an intact structure. After SARS-CoV-2 infection (b), GRASP55 level is reduced, resulting in Golgi fragmentation that may facilitate viral assembly and trafficking. Conversely, when GRASP55 is exogenously expressed (c), the Golgi structure is reinforced and the viral assembly and trafficking speed is limited, thus inhibiting spike incorporation and viral release. Created with BioRender. Data are shown as mean ± SD. Statistical analyses are performed using two-tailed Student’s t-test. **, p < 0.01; ***, p < 0.001; n.s., not significant.
Fig 6
Fig 6. Depletion of GRASP55 promotes SARS-CoV-2 assembly and secretion.
(A) Immunoblots of cell lysates and PEG-precipitated culture media of Huh7-ACE2 transfected with siControl or siGRASP55 oligos for 48 h followed by SARS-CoV-2 infection (MOI = 3) for 24 h for indicated proteins. (B-G) Quantification of the relative expression of spike (B, E), N (C, F), and relative spike/N ratio (D, G) from cell lysates and culture media, respectively. (H-I) TCID50 assay (H) and plaque assay (I) of viruses collected from Huh7-ACE2 transfected with siControl or siGRASP55 oligos for 48 h followed by infection with SARS-CoV-2 (MOI = 3) for 24 h. (J-K) Intracellular viral titer assay (J) and released viral titer assay (K) of Huh7-ACE2 cells transfected with siControl or siGRASP55 oligoes and infected with SARS-CoV-2 (MOI = 5) for 10 h with 6 replicates from two independent experiments. (L) Representative LDH assay of Huh7-ACE2 cells transfected with siControl or siGRASP55 oligoes and infected with SARS-CoV-2 (MOI = 5) for 10 h with 4 technical replicates from two independent experiments. Data are shown as mean ± SD. Statistical analyses are performed using two-tailed Student’s t-test. *, p < 0.05; **, p < 0.01; ***, p < 0.001; n.s., not significant.
Fig 7
Fig 7. TGN46 depletion impairs SARS-CoV-2 trafficking.
(A, C) TGN46 depletion reduces SARS-CoV-2 infection. Huh7-ACE2 cells were transfected with siControl or siTGN46 oligos for 48 h followed by infection (MOI = 1) with the WA1 strain (A) or Delta variant (C) of SARS-CoV-2 for 24 h and stained for nucleocapsid. Shown are representative fluorescence images from 30 random images from two independent experiments. Scale bars, 100 μm. (B, D) Quantification of the viral infection percentage in A and C, respectively. (E) TGN46 depletion reduces viral protein expression in host cells. Huh7-ACE2 cells were transfected with siControl or siTGN46 oligos for 48 h followed by infection with SARS-CoV-2 WA1 strain and Delta variant (MOI = 3) for 24 h. Cell lysates were blotted for indicated proteins. Long and short exposures are shown for spike and N proteins. (F) Immunoblots of cell lysates and PEG-precipitated culture media of Huh7-ACE2 transfected with siControl or siTGN46 oligos for 48 h followed by SARS-CoV-2 infection (MOI = 3) for 24 h for indicated proteins. (G-L) Quantification of the relative expression of spike (G, J), N (H, K), and relative spike/N ratio (I, L) from cell lysates and culture media, respectively. (M-N) TCID50 assay (M) and plaque assay (N) of viruses collected from Huh7-ACE2 transfected with siControl or siTGN46 oligos for 48 h followed by infection with SARS-CoV-2 for 24 h. (O-P) Intracellular viral titer assay (O) and released viral titer assay (P) of Huh7-ACE2 cells transfected with siControl or siTGN46 oligoes and infected with SARS-CoV-2 (MOI = 5) for 10 h with 6 replicates from two independent experiments. (Q) Representative LDH assay of Huh7-ACE2 cells transfected with siControl or siTGN46 oligoes and infected with SARS-CoV-2 (MOI = 5) for 10 h with 4 technical replicates from two independent experiments. (R) Representative RT-qPCR assay of Huh7-ACE2 cells transfected with siControl or siTGN46 oligoes and infected with SARS-CoV-2 (MOI = 5) for 4 h with 4 technical replicates from two independent experiments. Data are shown as mean ± SD. Statistical analyses were performed using two-tailed Student’s t-test. *, p < 0.05; **, p < 0.01; ***, p < 0.001; n.s., not significant.

Update of

Similar articles

Cited by

References

    1. Planas D, Veyer D, Baidaliuk A, Staropoli I, Guivel-Benhassine F, Rajah MM, et al. Reduced sensitivity of SARS-CoV-2 variant Delta to antibody neutralization. Nature. 2021;596(7871):276–80. doi: 10.1038/s41586-021-03777-9 - DOI - PubMed
    1. Hoffmann M, Kleine-Weber H, Schroeder S, Krüger N, Herrler T, Erichsen S, et al. SARS-CoV-2 Cell Entry Depends on ACE2 and TMPRSS2 and Is Blocked by a Clinically Proven Protease Inhibitor. Cell. 2020;181(2):271–80.e8. doi: 10.1016/j.cell.2020.02.052 - DOI - PMC - PubMed
    1. Shang J, Wan Y, Luo C, Ye G, Geng Q, Auerbach A, et al. Cell entry mechanisms of SARS-CoV-2. Proc Natl Acad Sci U S A. 2020;117(21):11727–34. doi: 10.1073/pnas.2003138117 - DOI - PMC - PubMed
    1. Khoury DS, Wheatley AK, Ramuta MD, Reynaldi A, Cromer D, Subbarao K, et al. Measuring immunity to SARS-CoV-2 infection: comparing assays and animal models. Nat Rev Immunol. 2020;20(12):727–38. doi: 10.1038/s41577-020-00471-1 - DOI - PMC - PubMed
    1. Gordon DE, Jang GM, Bouhaddou M, Xu J, Obernier K, White KM, et al. A SARS-CoV-2 protein interaction map reveals targets for drug repurposing. Nature. 2020;583(7816):459–68. doi: 10.1038/s41586-020-2286-9 - DOI - PMC - PubMed

Substances