. 2025 Jun 20;11(25):eadu0772.
doi: 10.1126/sciadv.adu0772. Epub 2025 Jun 20.

TGFβ-dependent signaling drives tumor growth and aberrant extracellular matrix dynamics in NF1-associated plexiform neurofibroma

Affiliations

TGFβ-dependent signaling drives tumor growth and aberrant extracellular matrix dynamics in NF1-associated plexiform neurofibroma

Mohannad Abu-Sultanah et al. Sci Adv. .

Abstract

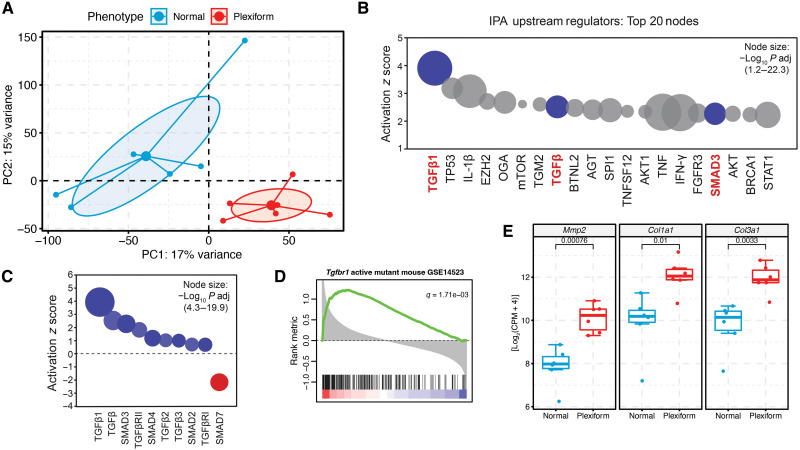
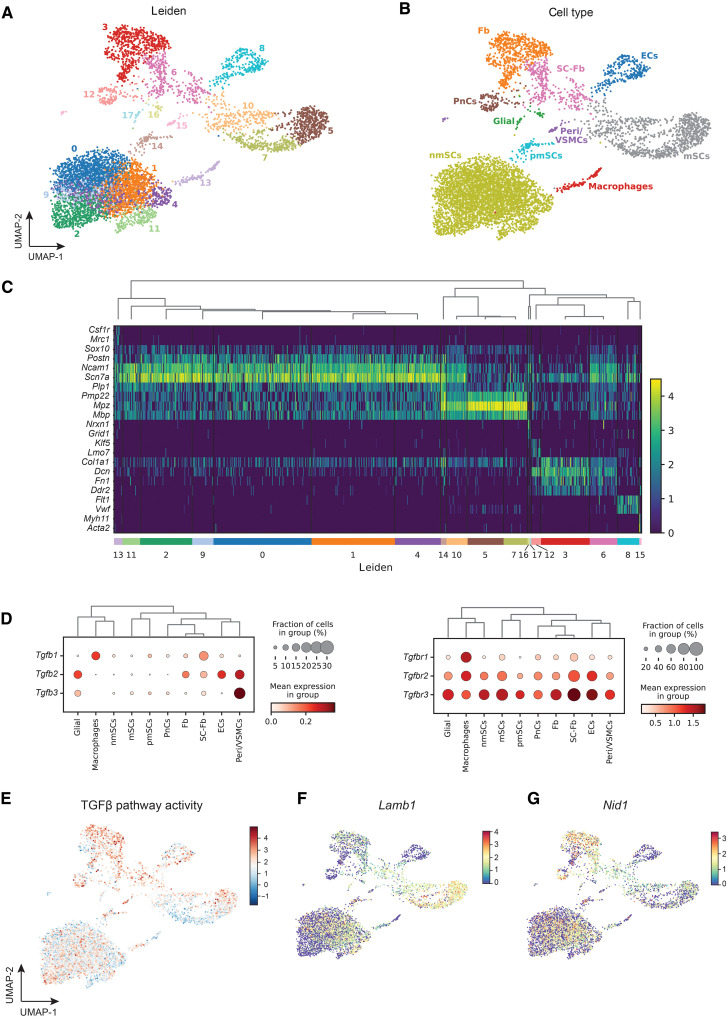
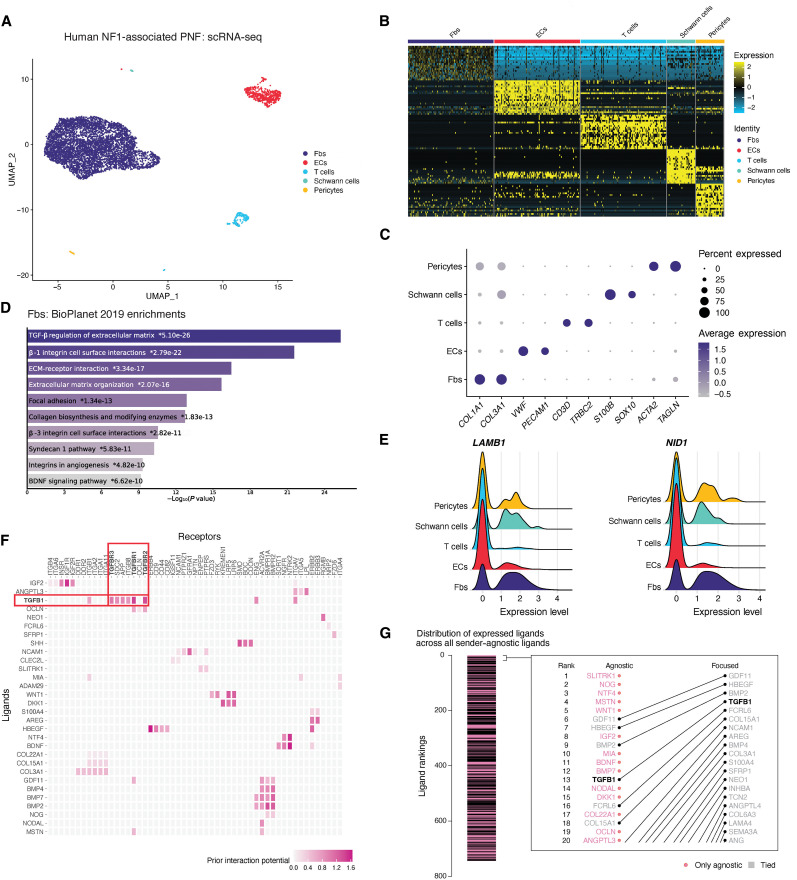
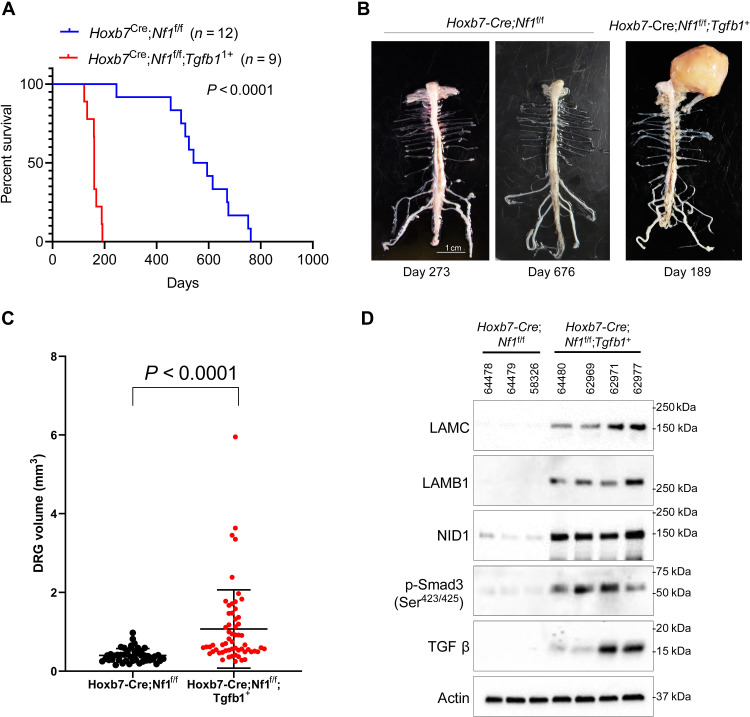
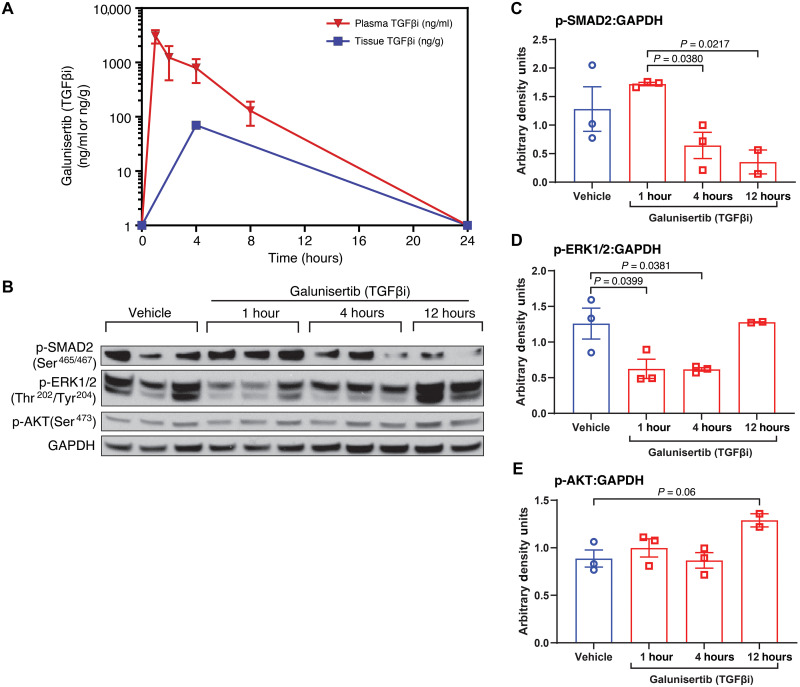
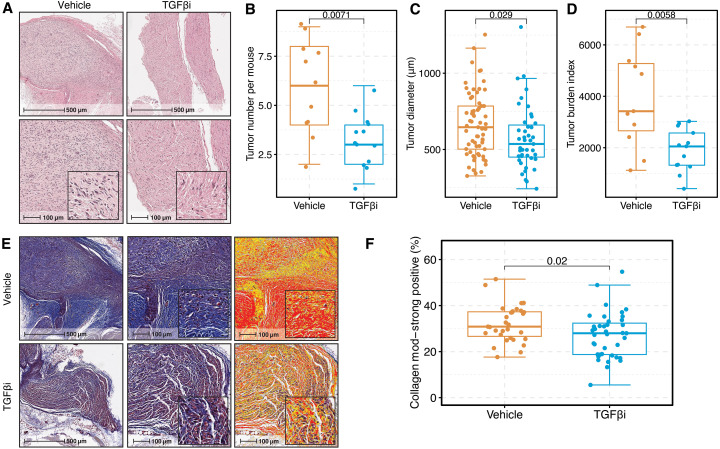
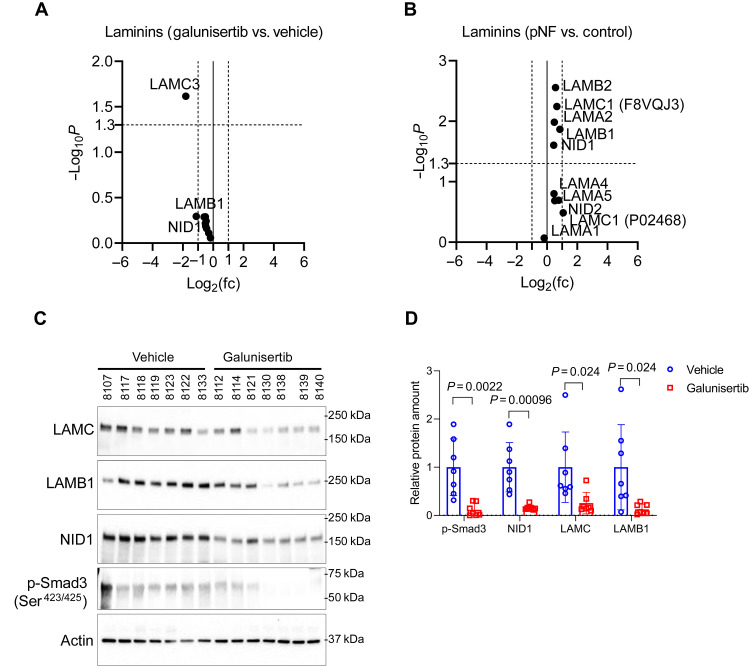
Plexiform neurofibromas (PNFs) are benign tumors of the peripheral nervous system that represent a major source of morbidity in neurofibromatosis type 1 (NF1). A substantial proportion of patients do not respond to current therapies or experience intolerable side effects. Transcriptomic characterization of murine and human PNF at bulk and single-cell resolution identified transforming growth factor-β (TGFβ) signaling as a key upstream regulator, driving aberrant basement membrane (BM) protein production by neoplastic Schwann cells and Fbs. Conditional TGFβ1 overexpression in Nf1-deficient Schwann cells driven by Hoxb7-Cre promoted PNF growth and malignant transformation in vivo. Conversely, pharmacologic inhibition of the type I TGFβ receptor (TGFβRI) reduced PNF tumor burden in Nf1 mutant mice. Proteomic characterization of the extracellular matrix (ECM) showed reduced BM proteins upon TGFβRI inhibition. These findings implicate TGFβ as a potential therapeutic target in PNF and provide insights into the role of TGFβ signaling in orchestrating ECM dynamics in the PNF microenvironment.


Figures

Fig. 1.
Fig. 1.. TGFβ is a key upstream regulator in murine PNF.
(A) Principal components analysis (PCA) of bulk RNA-seq data from PNF-bearing Nf1flox/flox;PostnCre+ nerve tissue and normal control nerve from wild-type (WT) (Nf1flox/flox;PostnCre) mice (n = 6 per group). (B) Top 20 upstream regulators with positive activation z scores in PNF-bearing nerve tissue in comparison to normal control (n = 6 per group). Nodes are ranked by activation z score; node size reflects the –log10-adjusted P (P adj) value (range: 1.2 to 22.3). Nodes related to TGFβ signaling are highlighted in red text and blue dots. IL-1β, interleukin-1β; mTOR, mammalian target of rapamycin; IFN-γ, interferon-γ; STAT1, signal transducer and activator of transcription 1. (C) Key components of the canonical TGFβ signaling pathway are shown, including ligands (TGFβ1, 2, and 3), receptors (TGFβRI and II), and SMAD effectors (SMAD2, 3, 4, and 7). Nodes are ranked by activation z score, with blue nodes indicating positive and red nodes (SMAD7) indicating negative activation. Node size reflects –log10-adjusted P value (range: 4.3 to 19.9). (D) Gene set enrichment analysis (GSEA) reveals enrichment of a TGFβRI-activated mutant mouse gene signature in PNF-bearing nerve tissue from Nf1flox/flox;PostnCre mice compared to WT controls (n = 6 per group). Black bars indicate the rank of individual genes comprising the signature. The green curve corresponds to the running enrichment score (q = 1.71 × 10⁻³). (E) Box-and-whisker plots show Col1a1, Col3a1, and Mmp2 transcript expression from RNA-seq data in murine PNF versus normal nerve (n = 6 per group). Dots represent individual samples. Whiskers extend to 1.5× the interquartile range. The center line represents the median. The box spans the 25th to 75th percentiles. Outliers are plotted as individual points beyond the whiskers. P values indicate unpaired, two-tailed t tests between groups.
Fig. 2.
Fig. 2.. Schwann cells and Fbs exhibit enhanced TGFβ pathway activity and up-regulation of BM proteins in murine PNF.
UMAP plots showing distinct clusters (A) and cell types (B) detected in PNF from Nf1flox/flox;PostnCre+ mice using snRNA-seq (n = 6604 cells pooled from five independent mice). Cell types are abbreviated as follows: pmSCs, mSCs, nmSCs, SC-Fb, Fb, glial cells, PnCs, ECs, peri/VSMCs, and macrophages. (C) Heatmap of top marker genes for each cluster. (D) Dot plots of TGFβ ligand (Tgfb1, Tgfb2, and Tgfb3) and receptor (Tgfb1, Tgfb2, and Tgfb3) expression by cell type. UMAP plots of TGFβ pathway activation score (E), Lamb1 (F), and Nid1 (G) expression.
Fig. 3.
Fig. 3.. Ligand-receptor analysis predicts a critical role for TGFβ-dependent intracellular cross-talk in governing Schwann cell intrinsic gene expression programs in human PNF.
(A) UMAP plot showing cell types identified by scRNA-seq analysis of a PNF resected from a 16-year-old female NF1 patient (n = 6639 cells). (B) Heatmap of the top 20 differentially expressed genes (rows) across each cell type (columns), downsampled to a maximum of 100 cells per cell type. (C) Dot plot of selected maker gene expression across various cell types including Fbs (COL1A1 and COL3A1), ECs (VWF and PECAM1), T cells (CD3D and TRBC2), Schwann cells (S100B and SOX10), and pericytes (ACTA2 and TAGLN). The color represents the scaled average of marker genes in each cell type, and the size reflects the proportion of a given cell type expressing the marker. (D) Differentially expressed genes up-regulated in the Fb cluster (log2 fold change ≥ 1) were queried against the BioPlanet 2019 database in Enrichr. The top 10 enriched genesets are plotted in rank order according to their –log10-adjusted P value. BDNF, brain-derived neurotrophic factor. (E) Ridge plots of LAMB1 and NID1 demonstrating enhanced expression in Fbs, Schwann cells, and pericytes relative to other cell types. (F) Heatmap of top Schwann cell ligand-receptor interactions predicted by NicheNet analysis. Ligands and receptors are ordered by hierarchical clustering. (G) Comparison of ligand rankings between sender-agnostic and sender-focused approaches. Schwann cells represent the receiver cell population in both analyses. All other cell types (Fbs, ECs, pericytes, and T cells) represent potential senders. Pink bars denote sender-agnostic ligands that are filtered out in the sender-focused approach due to lack of expression.
Fig. 4.
Fig. 4.. TGFβ1 overexpression promotes PNF progression in vivo.
(A) Survival of Hoxb7-Cre;Nf1f/f (n = 12) and Hoxb7-Cre;Nf1f/f;Tgfb1+ (n = 9) mutant mice was compared by Kaplan-Meier analysis. P < 0.0001 (log-rank test). (B) Representative images showing spinal cords extracted from Hoxb7-Cre;Nf1f/f and Hoxb7-Cre;Nf1f/f;Tgfb1+ mutant mice, which develop PNF and MPNST. (C) DRG volumes were measured and significantly larger in Hoxb7-Cre;Nf1f/f;Tgfb1+ mutant mice. n = 3 pairs of mice with 13 to 23 DRGs quantified for each mouse. (D) LAMC, LAMB1, NID1, p-SMAD3, and TGFβ were detected by Western blot in DRGs extracted from Hoxb7-Cre;Nf1f/f (n = 3) and Hoxb7-Cre;Nf1f/f;Tgfb1+ mutant mice (n = 4). Actin is shown as the loading control. Mice 64478 and 64479 (Nf1flox/flox;Hoxb7-Cre+) and 64480 (Nf1flox/flox;Tgfb1+;Hoxb7-Cre+) were collected at 54 days, representing young age. Mice 58326 (Nf1flox/flox;Hoxb7-Cre+) and 62969, 62971, and 62977 (Nf1flox/flox;Tgfb1+;Hoxb7-Cre+) were collected at 160 days, representing mid-age.
Fig. 5.
Fig. 5.. Pharmacokinetic and pharmacodynamic profiling of galunisertib (TGFβi) in Nf1flox/flox;PostnCre+ PNF-bearing mice in vivo.
(A) Concentration-time profiles of galunisertib in plasma and nerve tissue samples from n = 3 mice at each time point. Plasma samples were assayed at 1, 2, 4, 8, and 24 hours, while tissue samples were harvested at 4 and 24 hours after a single 75 mg/kg dose of galunisertib administered by oral gavage. (B) p-SMAD2 (Ser465/467), phosphorylation of extracellular signal–regulated kinase 1/2 (p-ERK1/2; Thr202/Tyr204), and AKT phosphorylation (p-AKT; Ser473) were detected by Western blot in sciatic nerve tissues at 1, 4, and 12 hours after administration of vehicle or galunisertib. Glyceraldehyde-3-phosphate dehydrogenase (GAPDH) is shown as the loading control. Bar plots depict quantitative analysis of p-SMAD2 (C), p-ERK1/2 (D), and p-AKT (E) signal intensity in arbitrary densitometry units normalized to GAPDH as the loading control. Dots represent individual data points. P values denote statistical significance as determined by one-way analysis of variance (ANOVA), followed by Šidák’s multiple comparisons test between groups as annotated on the graphs. Error bars represent the SEM. n = 3 independent biological replicates per group, except for the 12-hour time point for which n = 2 replicates are shown. Vehicle-treated samples were harvested at the 12-hour time point.
Fig. 6.
Fig. 6.. Pharmacologic TGFβRI inhibition reduces PNF burden in vivo.
(A) Representative H&E-stained nerve tissue sections from Nf1flox/flox;PostnCre+ tumor-bearing mice following 12 weeks of treatment with either vehicle or TGFβi. Scale bars denote the level of magnification with high-power insets as shown. (B) Quantification of PNF tumor number in vehicle-treated (n = 11, 5 males and 6 females) versus TGFβi-treated mice (n = 13, 8 males and 5 females). P = 0.0071 (unpaired, two-tailed t test). (C) Diameter (in micrometers) of individual PNF tumors measured in vehicle-treated (n = 65 tumors from 11 mice) and TGFβi-treated mice (n = 43 tumors from 13 mice). P = 0.029 (unpaired, two-tailed t test). (D) The TBI was compared between vehicle-treated (n = 11) and TGFβi-treated mice (n = 13). P = 0.0058 (unpaired, two-tailed t test). (E) Collagen was detected by Masson’s trichrome stain. Representative photomicrographs demonstrate blue-stained collagen at low and high magnification. Bottom row shows HALO image analysis masks: yellow, orange, and red indicate weak (1+), moderate (2+), and strong (3+) collagen staining, respectively. Nontissue background was excluded using a tissue classifier. (F) Box-and-whisker plots of the percentage of collagen-stained tissue exhibiting moderate to strong positive staining (2 to 3+) relative to total tissue area in tumor regions. Quantification was performed using HALO software. Vehicle-treated [n = 31 regions of interest (ROIs) from 11 mice] and TGFβi-treated groups (n = 39 ROIs from 13 mice) were evaluated. Dots represent individual data points. Whiskers extend to 1.5× the interquartile range. The center line represents the median. The box spans the 25th to 75th percentiles. Outliers are plotted as individual points beyond the whiskers. P = 0.02 (unpaired, two-tailed t test).
Fig. 7.
Fig. 7.. TGFβRI inhibition reduces BM protein deposition within the PNF ECM.
(A) Volcano plot of the mass spectrometry dataset showing –log10 P values plotted against log2 fold change (fc) for BM proteins in PNF-bearing sciatic nerve tissue from galunisertib- versus vehicle-treated mice (n = 3 per group). (B) Volcano plot of the mass spectrometry dataset showing –log10 P values plotted against log2 fc for BM proteins in PNF versus control tissue (n = 4 per group). (C) LAMC, LAMB1, NID1, and p-SMAD3 were detected by Western blot in PNF tissue from vehicle-treated (n = 7) and galunisertib-treated (n = 7) mice. (D) Quantitative Western blot analysis by densitometry showing relative expression of p-SMAD3, NID1, LAMC, and LAMB1 in PNF tissue from vehicle-treated (n = 7) and galunisertib-treated (n = 7) mice. Data are shown as mean ± SEM. Comparisons among groups were performed by unpaired Welch’s t test.

Similar articles

References

    1. Peltonen J., Penttinen R., Larjava H., Aho H. J., Collagens in neurofibromas and neurofibroma cell cultures. Ann. N. Y. Acad. Sci. 486, 260–270 (1986). - PubMed
    1. Martin G. A., Viskochil D., Bollag G., McCabe P. C., Crosier W. J., Haubruck H., Conroy L., Clark R., O’Connell P., Cawthon R. M., Innis M. A., McCormick F., The GAP-related domain of the neurofibromatosis type 1 gene product interacts with ras p21. Cell 63, 843–849 (1990). - PubMed
    1. Viskochil D., Buchberg A. M., Xu G., Cawthon R. M., Stevens J., Wolff R. K., Culver M., Carey J. C., Copeland N. G., Jenkins N. A., White R., O’Connell P., Deletions and a translocation interrupt a cloned gene at the neurofibromatosis type 1 locus. Cell 62, 187–192 (1990). - PubMed
    1. Gross A. M., Wolters P. L., Dombi E., Baldwin A., Whitcomb P., Fisher M. J., Weiss B., Kim A., Bornhorst M., Shah A. C., Martin S., Roderick M. C., Pichard D. C., Carbonell A., Paul S. M., Therrien J., Kapustina O., Heisey K., Clapp D. W., Zhang C., Peer C. J., Figg W. D., Smith M., Glod J., Blakeley J. O., Steinberg S. M., Venzon D. J., Doyle L. A., Widemann B. C., Selumetinib in children with inoperable plexiform neurofibromas. N. Engl. J. Med. 382, 1430–1442 (2020). - PMC - PubMed
    1. McCowage G. B., Mueller S., Pratilas C. A., Hargrave D. R., Moertel C. L., Whitlock J., Fox E., Hingorani P., Russo M. W., Dasgupta K., Tseng L., Mookerjee B., Geoerger B., Trametinib in pediatric patients with neurofibromatosis type 1 (NF-1)–associated plexiform neurofibroma: A phase I/IIa study. J. Clin. Oncol. 36, 10504–10504 (2018).

MeSH terms

Substances