. 2025 Jun 20;11(25):eado4170.
doi: 10.1126/sciadv.ado4170. Epub 2025 Jun 20.

Regulation of MORC-1 is key to the CSR-1-mediated germline gene licensing mechanism in C. elegans

Affiliations

Regulation of MORC-1 is key to the CSR-1-mediated germline gene licensing mechanism in C. elegans

Jessica A Kirshner et al. Sci Adv. .

Abstract

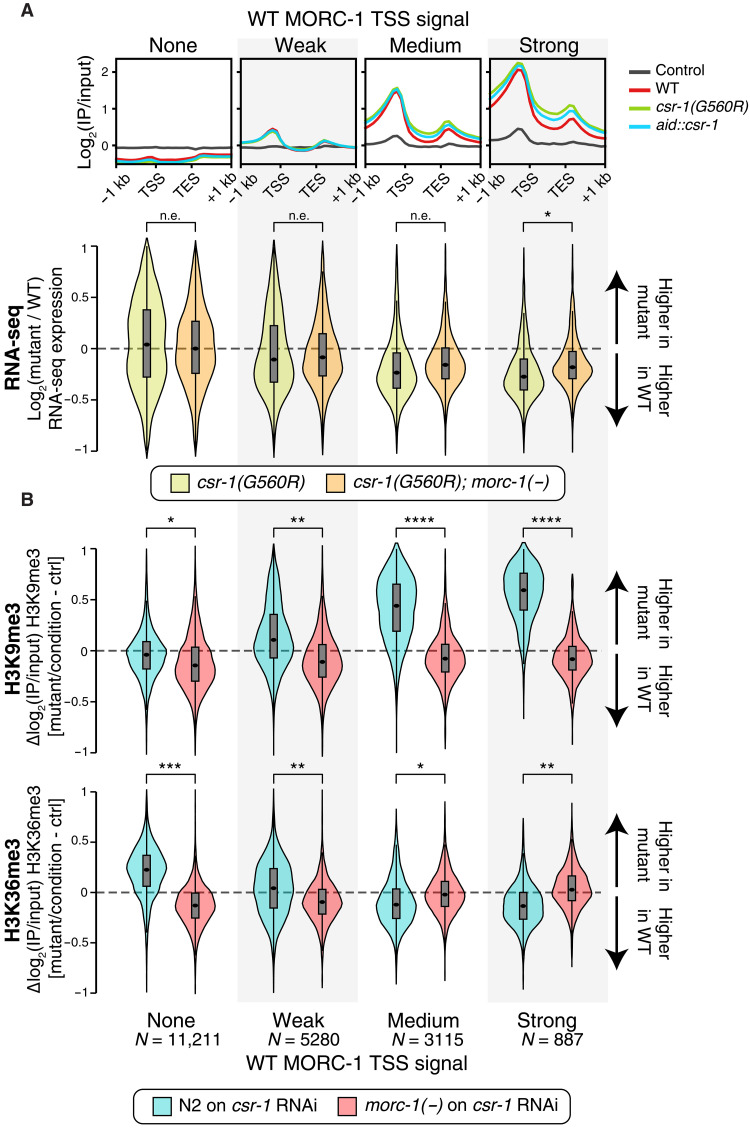
The Argonaute CSR-1 is essential for germline development in C. elegans. Loss of CSR-1 leads to the down-regulation of thousands of germline-expressed genes, supporting a model in which CSR-1 "licenses" gene expression via a poorly understood mechanism. In contrast, a small subset of genes is up-regulated in csr-1 mutants, including morc-1, which encodes a conserved GHKL-type ATPase. We show that morc-1 is overexpressed in csr-1 mutants and accumulates over CSR-1 licensed targets, coinciding with aberrant gain of H3K9me3, reduced H3K36me3, and transcriptional repression. Notably, loss of morc-1 fully rescues these chromatin defects and partially restores gene expression and fertility in csr-1 mutants. Conversely, ectopic overexpression of MORC-1 in the wild-type germ line is sufficient to repress CSR-1 licensed targets and severely compromise fertility. These findings support a model in which CSR-1 prevents MORC-1 overexpression and consequent misregulation of CSR-1 licensed genes.


Figures

Fig. 1.
Fig. 1.. morc-1(−) is a suppressor of csr-1.
(A) Fertility of wild-type (WT; N2) or morc-1(−) worms grown on either EV or csr-1 RNAi. Each point represents the viable progeny produced by an individual worm. (B) Diagram of CSR-1 gene and protein structure for both isoforms, as well as the two csr-1 mutants generated in this study: aid::csr-1 and csr-1(G560R). Exons 2 and 3 are labeled for reference. The approximate location of the three protein domains PAZ, MID, and PIWI is also shown. (C) Fertility of wild-type, morc-1(−), csr-1(G560R), and csr-1(G560R); morc-1(−) double mutant worms. Each point represents the viable progeny produced by an individual worm. Left shows progeny of the first generation (P0) grown at the csr-1(G560R) nonpermissive temperature of 25°C, while the right shows progeny of second generation (F1) worms, also grown at 25°C. Because csr-1(G560R) P0 worms did not produce any progeny at 25°C, their fertility in the F1 generation could not be assayed (n/a, not applicable). (D) Up-regulation of morc-1 mRNA in the csr-1SIN mutant by qPCR. Error bars represent SD between two technical replicates. (E) Up-regulation of morc-1 mRNA in wild type (N2), csr-1(G560R), and aid::csr-1, as well as on csr-1 or EV RNAi, by qPCR. Error bars represent SD between two technical replicates. AU, arbitrary units. (F) Western blot of MORC-1::3xFlag protein in both csr-1(G560R) and aid::csr-1, with H3 as a loading control. (G) Immunofluorescence of MORC-1::3xFlag (red) in csr-1(G560R) and aid::csr-1 in dissected germ lines of indicated genotype and treatment. DNA was stained with 4′,6-diamidino-2-phenylindole (DAPI). [(D) to (F)] Worms were treated with either 0 μM [(−) auxin] or 100 μM auxin [(+) auxin]. [(A) and (C)] ***P < 0.001, one-tailed t test.
Fig. 2.
Fig. 2.. MORC-1 binds at the transcriptional start site of protein coding genes and spreads in csr-1 mutants.
(A) Metaplots and heatmaps of anti-Flag ChIP-seq signal from purified germline nuclei of the MORC-1::3xFlag expressing strain or control wild-type worms lacking Flag (no-Flag control). Metaplots show average signal across all protein-coding genes (PCGs), transposon elements (TEs), and repeat regions (repeats). In heatmaps, each row corresponds to a single PCG, TE, or repeat. Features were scaled to 1-kb length. Each IP sample was normalized to matched input sample [log2(IP/input)], and values represent average of two replicates (averaged before log transformation). (B) Example genome browser images showing average log2(IP/input) MORC-1::3xFlag signal in wild-type germ line (red), csr-1(G560R) (green), and aid::csr-1 (blue), as well a no-Flag control (gray). Genes, transposons, and repeats shown on bottom tracks. Genes on the forward and reverse strands are colored yellow and blue, respectively, while CSR-1 targets are circled red. (C) Overlap between CSR-1 targets (green) (3), germline expressed genes (purple) (32), and MORC-1 targets identified in this study based on MORC-1 enrichment over the promoter and transcriptional start site (TSS) (yellow). ***P ~ 0, hypergeometric test. (D) Metaplots and heatmaps showing MORC-1::3xFlag localization in wild type and both csr-1(G560R) and aid::csr-1 [(+) auxin], over CSR-1 target genes versus nontargets. (E) Average germline log2(IP/input) MORC-1::3xFlag signal in wild type (red), csr-1(G560R) (green), aid::csr-1 (blue), and no-Flag control (gray), over genes binned by MORC-1 TSS signal in wild type. Genes were scaled to 1-kb length. Plots are over genes binned by promoter (±500 bp around TSS) MORC-1 levels (see data S2). (F) Distribution of change in average MORC-1::3xFlag ChIP-seq signal in csr-1(G560R) compared to wild type, over either the TSS region (±500 bp around TSS, blue) or gene body (pink), in genes binned based on MORC-1 TSS signal in wild type [bins same as (E)].
Fig. 3.
Fig. 3.. Genes highly bound by MORC-1 are consistently down-regulated in both csr-1(G560R) and aid::csr-1.
(A) Top: Metaplots of MORC-1::3xFlag ChIP-seq signal in wild type, csr-1(G560R), and aid::csr-1 [(+) auxin] over genes binned by wild-type MORC-1 signal over TSS (same as Fig. 2E). Bottom: Distribution of RNA-seq log2 fold change values in indicated mutant over control, estimated by DESeq2 (65), across genes binned by wild-type MORC-1 level at TSS as in (A). A small number of genes outside of y in [−1,1] not shown. (B) Metaplots and heatmaps of change in MORC-1::3xFlag ChIP-seq signal in both csr-1(G560R) and aid::csr-1 [(+) auxin] compared to control [difference in log2(IP/input) signal] over all PCGs (rows of heatmap). Genes were clustered using the k-means algorithm into six clusters, named C1 to C6. (C) Distribution of RNA-seq log2 fold change values in indicated mutant over control, estimated by DESeq2, across gene clusters from (C). (D) Percent of genes in each cluster from (C) that are CSR-1 targets (3) versus nontargets. (B and D) A small number of genes with y outside [−1,1] not shown. Significance testing: ***P < 0.0001, and*P < 0.01 and P > 0.001. n.s., not significant; two-sample Wilcoxon rank-sum test with the null hypothesis that the observed distribution of log2 fold change values is drawn from the same distribution as (B) genes lacking MORC-1 at the TSS (none) or (D) genes in cluster 6 (“C6”). [(B) to (D)] Control for csr-1(G560R) is N2 (wild type), and control for aid::csr-1 [(+) auxin] is aid::csr-1 [(−) auxin].
Fig. 4.
Fig. 4.. morc-1(−) rescues csr-1 defects in gene expression and chromatin states.
(A) Top: Same as Fig. 2E: average MORC-1::3xFlag ChIP-seq signal in wild type, csr-1(G560R, aid::csr-1, and no-Flag control, over genes binned by promoter (±500 bp around TSS) MORC-1 levels. Bottom: Distribution of change in gene expression in indicated mutant versus wild type, over genes binned based on MORC-1 levels at the TSS in wild type, as in the top panel. Log2(fold change) values were estimated by DESeq2 (65). Number of genes in each bin shown at the bottom (B). (B) Difference in H3K9me3 and H3K36me3 ChIP-seq signal [log2(IP/input)] in indicated mutant and/or condition, compared to wild-type worms treated with control RNAi. Genes were again binned on the basis of MORC-1 levels at the TSS in wild type, as in (A) and (B). [(A) and (B)]Stars indicate effect size as measured using Cohen’s d. n.e., no/minimal effect (|d| < 0.2); *|d| > 0.2, **|d| > 0.5, ***|d| > 0.9, and ****|d| > 1.5. All comparisons give P ~ 0 by Student’s t test due to large sample size.
Fig. 5.
Fig. 5.. MORC-1 overexpression in wild-type germline phenocopies csr-1 fertility and expression defects.
(A) Schematic of the conditional germline MORC-1 overexpression line (morcOE; see Materials and Methods). (B) Expected phenotypes of morcOE stock worms maintained on hygromycin (extrachromosomal array retained), worms removed from hygromycin that have lost the extrachromosomal array and express all genes on the integrated transgene, and worms that have lost the integrated transgene. (C) Fertility of F2 morcOE worms off selection, comparing worms that have lost the integrated morc-1 transgene to those that retained it. The transgene was considered lost if either mCherry expression was lost or worms became uncoordinated [Unc; see (B) and data S4]. ***P < 0.001, two-tailed t test. (D) Schematic of experimental design (see Materials and Methods). F2 worms not on neomycin were manually separated into transgene-expressing and transgene-lost populations based on expression of neuronal mCherry. morcOE worms maintained on neomycin always retained mCherry expression but were sick and had low fertility, so few worms remained by F2. Hyg, hygromycin; Neo, neomycin; none, no selection. (E) Expression changes by RNA-seq of CSR-1 targets versus nontargets in the three populations of morcOE F2 worms assayed: neomycin selection, no selection with mCherry ON, and no selection with mCherry OFF, see (D), each compared to a no-transgene control. (F) Expression changes by RNA-seq of genes binned by wild-type MORC-1 occupancy at TSS (Fig. 2E), in the three populations of morcOE F2 worms assayed, compared to a no-transgene control. [(E) and (F)] Expression change shown is the log2(fold change) value estimated by DESeq2 (65). Effect size measured using Cohen’s d. n.e., no/minimal effect (|d| < 0.2); *|d| > 0.2, **|d| > 0.5, ***|d| > 0.9, and ****|d| > 1.5. All comparisons give P ~ 0 by Student’s t test, due to large sample size.

Similar articles

References

    1. Seroussi U., Lugowski A., Wadi L., Lao R. X., Willis A. R., Zhao W., Sundby A. E., Charlesworth A. G., Reinke A. W., Claycomb J. M., A comprehensive survey of C. elegans argonaute proteins reveals organism-wide gene regulatory networks and functions. eLife 12, e83853 (2023). - PMC - PubMed
    1. Yigit E., Batista P. J., Bei Y., Pang K. M., Chen C.-C. G., Tolia N. H., Joshua-Tor L., Mitani S., Simard M. J., Mello C. C., Analysis of the C. elegans Argonaute family reveals that distinct Argonautes act sequentially during RNAi. Cell 127, 747–757 (2006). - PubMed
    1. Claycomb J. M., Batista P. J., Pang K. M., Gu W., Vasale J. J., van Wolfswinkel J. C., Chaves D. A., Shirayama M., Mitani S., Ketting R. F., Conte D., Mello C. C., The Argonaute CSR-1 and its 22G-RNA cofactors are required for holocentric chromosome segregation. Cell 139, 123–134 (2009). - PMC - PubMed
    1. Cecere G., Hoersch S., O’Keeffe S., Sachidanandam R., Grishok A., Global effects of the CSR-1 RNA interference pathway on the transcriptional landscape. Nat. Struct. Mol. Biol. 21, 358–365 (2014). - PMC - PubMed
    1. Updike D. L., Strome S., A genomewide RNAi screen for genes that affect the stability, distribution and function of P granules in Caenorhabditis elegans. Genetics 183, 1397–1419 (2009). - PMC - PubMed

MeSH terms

LinkOut - more resources