. 2025 Jun 18:47:103830.
doi: 10.1016/j.nicl.2025.103830. Online ahead of print.

Hippocampus and amygdala volume and morphology in neurodegenerative disorders with co-morbid epilepsy

Affiliations

Hippocampus and amygdala volume and morphology in neurodegenerative disorders with co-morbid epilepsy

Ifrah Zawar et al. Neuroimage Clin. .

Abstract

Background: Epilepsy is common in Alzheimer's disease (AD) and non-AD dementias. However, the neuroimaging correlates of epilepsy in dementias remain unexplored. We investigated mesial temporal morphology and volumes in AD (AD + Epi) and nonAD dementias (nonAD + Epi) with epilepsy.

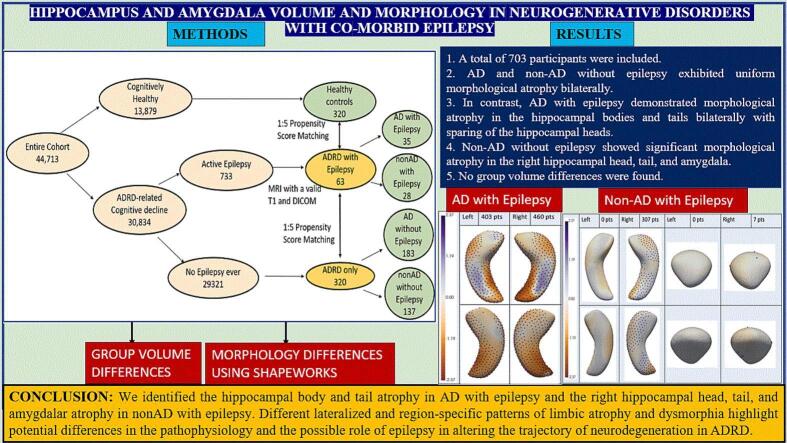
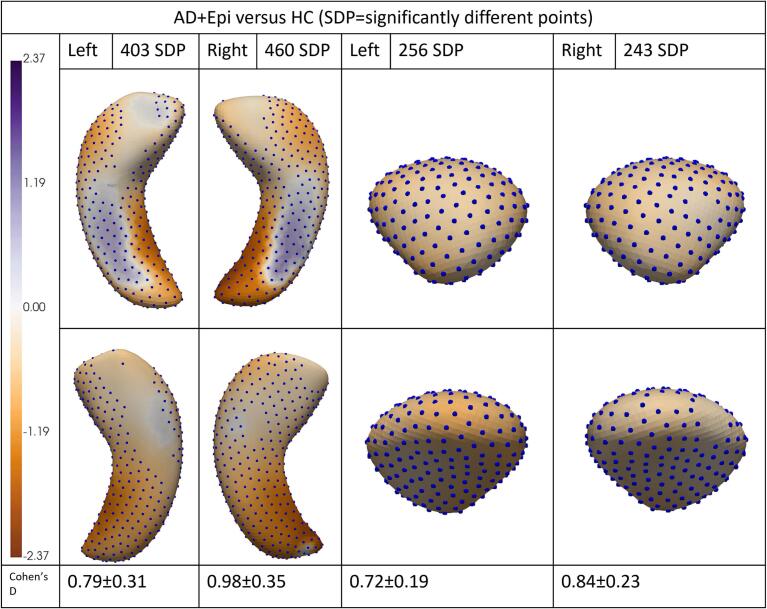
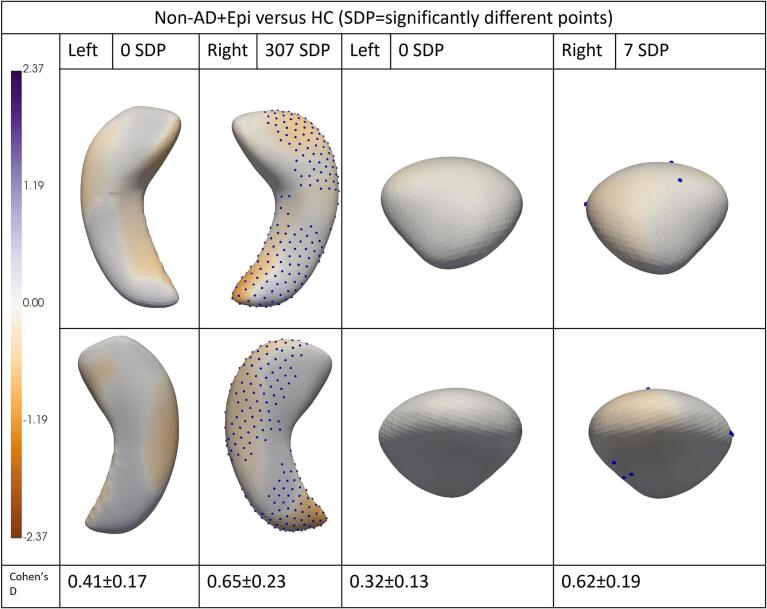
Methods: Participants from 39 US Alzheimer's disease centers (9/2005-12/2021) were classified into dementia with epilepsy (AD + Epi, nonAD + Epi), dementia without epilepsy (AD-Epi, nonAD-Epi); and healthy controls. Dementia with epilepsy participants with available MRIs were matched to dementia without epilepsy and healthy controls by age, sex, and dementia type (AD versus non-AD). FreeSurfer segmented hippocampi and amygdalae. Point distribution models created via ShapeWorks quantified morphological differences in the left and right hippocampi and amygdalae. Hippocampal and amygdalar volumes were normalized to the total intracranial volume. Multivariate analysis of covariates (MANCOVA), adjusted for age, sex, intracranial volume, and dementia severity, identified statistically significant local morphological and normalized volume group differences.

Result: A total of 703 participants (average age: 70.78 years, 391 (55.62 %) female) were included. AD-Epi and NonAD-Epi exhibited uniform hippocampal and amygdalar morphological atrophy bilaterally. In contrast, AD + Epi demonstrated morphological atrophy in the hippocampal bodies and tails bilaterally with sparing of the hippocampal heads, more pronounced inward deviations on mesial and lateral surfaces, and outward deviations in the middle hippocampal body bilaterally on the superior surface. NonAD + Epi showed significant morphological atrophy in the right hippocampal head, tail, and amygdala. No group volume differences were found.

Conclusion: We identified hippocampal body and tail atrophy in AD + Epi and right hippocampal head, tail, and amygdalar atrophy in nonAD + Epi. Different lateralized and region-specific patterns of limbic atrophy and dysmorphia highlight potential differences in the pathophysiology and the possible role of epilepsy in altering the trajectory of neurodegeneration in AD and nonAD.

Keywords: Active seizures; Alzheimer’s disease; Cognition; Dementia; Epilepsy; Non-Alzheimer’s disease; Seizures.


Conflict of interest statement

Declaration of competing interest The authors declare that they have no known competing financial interests or personal relationships that could have appeared to influence the work reported in this paper.

Figures

None
Graphical abstract
Fig. 1
Fig. 1
Study Cohort Selection. Participants with valid analyzable DICOM MRI T1 with ADRD and comorbid active epilepsy were identified as Group 1. Group 1 participants were matched with Group 2: 320 participants with mild cognitive impairment or dementia without epilepsy, and Group 3: 320 healthy controls using propensity score matching. Group 1 participants were subcategorized into AD with epilepsy and nonAD with epilepsy. Group 2 participants were categorized into AD without epilepsy and nonAD without epilepsy.
Fig. 2
Fig. 2
Mesial Temporal Morphology of AD with epilepsy compared to Healthy Controls. The purple colour corresponds to positive values and implies that the second group’s mean is smaller than the first group’s mean. The orange colour corresponds to negative values and implies that the first group's mean is smaller than the second group's means. Statistically significant points are shown as dots on the figures. (A): The left hippocampal group mean of AD with epilepsy (first group) is compared with healthy controls (second group), identifying 403 statistically significant points. (B): The right hippocampal group mean of AD with epilepsy (first group) is compared with healthy controls (second group), identifying 460 statistically significant points. (C): The left amygdalar group mean of AD with epilepsy (first group) is compared with healthy controls (second group), identifying 256 statistically significant points. (D): The right amygdalar group mean of AD with epilepsy (first group) is compared with healthy controls (second group), identifying 243 statistically significant points. (For interpretation of the references to colour in this figure legend, the reader is referred to the web version of this article.)
Fig. 3
Fig. 3
Mesial Temporal Morphology of AD without epilepsy compared to Healthy Controls. The purple colour corresponds to positive values and implies that the second group’s mean is smaller than the first group’s mean. The orange colour corresponds to negative values and implies that the first group's mean is smaller than the second group's means. Statistically significant points are shown as dots on the figures. (A): The left hippocampal group mean of AD without epilepsy (first group) is compared with healthy controls (second group), identifying 499 statistically significant points. (B): The right hippocampal group mean of AD without epilepsy (first group) is compared with healthy controls (second group), identifying 505 statistically significant points. (C): The left amygdalar group mean of AD without epilepsy (first group) is compared with healthy controls (second group), identifying 256 statistically significant points. (D): The right amygdalar group mean of AD without epilepsy (first group) is compared with healthy controls (second group), identifying 256 statistically significant points. (For interpretation of the references to colour in this figure legend, the reader is referred to the web version of this article.)
Fig. 4
Fig. 4
Mesial Temporal Morphology of AD with epilepsy compared to AD without Epilepsy. The purple colour corresponds to positive values and implies that the second group’s mean is smaller than the first group’s mean. The orange colour corresponds to negative values and implies that the first group's mean is smaller than the second group's means. Statistically significant points are shown as dots on the figures. (A): The left hippocampal group mean of AD with epilepsy (first group) is compared with AD without epilepsy (second group), identifying no significant differences in the left hippocampal morphology. (B): The right hippocampal group mean of AD with epilepsy (first group) is compared with AD without epilepsy (second group), identifying no significant differences in the right hippocampal morphology. (C): The left amygdalar group mean of AD with epilepsy (first group) is compared with AD without epilepsy (second group), identifying no significant differences in the left amygdalar morphology. (D): The right amygdalar group mean of AD with epilepsy (first group) is compared with AD without epilepsy (second group), identifying no significant differences in the right amygdalar morphology. (For interpretation of the references to colour in this figure legend, the reader is referred to the web version of this article.)
Fig. 5
Fig. 5
Mesial Temporal Morphology of non-AD with epilepsy compared to Healthy Controls. The purple colour corresponds to positive values and implies that the second group’s mean is smaller than the first group’s mean. The orange colour corresponds to negative values and implies that the first group's mean is smaller than the second group's means. Statistically significant points are shown as dots on the figures. (A): The left hippocampal group mean of non-AD with epilepsy (first group) is compared with healthy controls (second group), identifying no statistically significant points. (B): The right hippocampal group mean of non-AD with epilepsy (first group) is compared with healthy controls (second group), identifying 307 statistically significant points. (C): The left amygdalar group mean of non-AD with epilepsy (first group) is compared with healthy controls (second group), identifying no statistically significant points. (D): The right amygdalar group mean of non-AD with epilepsy (first group) is compared with healthy controls (second group), identifying 7 statistically significant points. (For interpretation of the references to colour in this figure legend, the reader is referred to the web version of this article.)
Fig. 6
Fig. 6
Mesial Temporal Morphology of non-AD without epilepsy compared to Healthy Controls. The purple colour corresponds to positive values and implies that the second group’s mean is smaller than the first group’s mean. The orange colour corresponds to negative values and implies that the first group's mean is smaller than the second group's means. Statistically significant points are shown as dots on the figures. (A): The left hippocampal group mean of non-AD without epilepsy (first group) is compared with healthy controls (second group), identifying 408 statistically significant points. (B): The right hippocampal group mean of non-AD without epilepsy (first group) is compared with healthy controls (second group), identifying 476 statistically significant points. (C): The left amygdalar group mean of non-AD without epilepsy (first group) is compared with healthy controls (second group), identifying 256 statistically significant points. (D): The right amygdalar group mean of non-AD without epilepsy (first group) is compared with healthy controls (second group), identifying 251 statistically significant points. (For interpretation of the references to colour in this figure legend, the reader is referred to the web version of this article.)
Fig. 7
Fig. 7
Mesial Temporal Morphology of non-AD with epilepsy compared to non-AD without Epilepsy. The purple colour corresponds to positive values and implies that the second group’s mean is smaller than the first group’s mean. The orange colour corresponds to negative values and implies that the first group's mean is smaller than the second group's means. Statistically significant points are shown as dots on the figures. (A): The left hippocampal group mean of non-AD with epilepsy (first group) is compared with non-AD without epilepsy (second group), identifying no significant differences in the left hippocampal morphology. (B): The right hippocampal group mean of non-AD with epilepsy (first group) is compared with non-AD without epilepsy (second group), identifying no significant differences in the right hippocampal morphology. (C): The left amygdalar group mean of non-AD with epilepsy (first group) is compared with non-AD without epilepsy (second group), identifying no significant differences in the left amygdalar morphology. (D): The right amygdalar group mean of non-AD with epilepsy (first group) is compared with non-AD without epilepsy (second group), identifying no significant differences in the right amygdalar morphology. (For interpretation of the references to colour in this figure legend, the reader is referred to the web version of this article.)

Similar articles

References

    1. Austin P.C., Xin Yu A.Y., Vyas M.V., Kapral M.K. Applying propensity score methods in clinical research in neurology. Neurology. 2021;97(18):856–863. doi: 10.1212/WNL.0000000000012777/ASSET/211D7022-DE84-488C-8562-ACDF6941477A/ASSETS/GRAPHIC/12TTU1.JPEG. - DOI - PMC - PubMed
    1. Baker J., Libretto T., Henley W., Zeman A. The prevalence and clinical features of epileptic seizures in a memory clinic population. Seizure. 2019 doi: 10.1016/j.seizure.2019.06.016. Published Online. - DOI - PubMed
    1. Beekly D.L., Ramos E.M., Lee W.W., et al. The National Alzheimer’s Coordinating Center (NACC) database: the uniform data set. Alzheimer Dis. Assoc. Disord. 2007 doi: 10.1097/WAD.0b013e318142774e. Published Online. - DOI - PubMed
    1. Breteler M.M.B., De Groot R.R.M., Van Romunde L.K.J., Hofman A. Risk of dementia in patients with Parkinson’s disease, epilepsy, and severe head trauma: a register-based follow-up study. Am. J. Epidemiol. 1995;142(12):1300–1305. doi: 10.1093/OXFORDJOURNALS.AJE.A117597. - DOI - PubMed
    1. Brodie M.J., Elder A.T., Kwan P. Epilepsy in later life. Lancet Neurol. 2009 doi: 10.1016/S1474-4422(09)70240-6. Published Online. - DOI - PubMed

LinkOut - more resources