

Construction and mechanism analysis of the sex reversal model of chicken gonadal somatic cells
- PMID: 40541104
- PMCID: PMC12214275
- DOI: 10.1016/j.psj.2025.105435
Construction and mechanism analysis of the sex reversal model of chicken gonadal somatic cells
Abstract
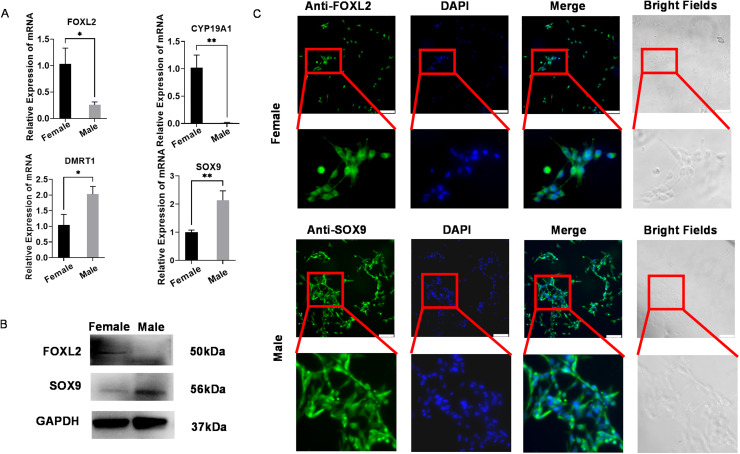
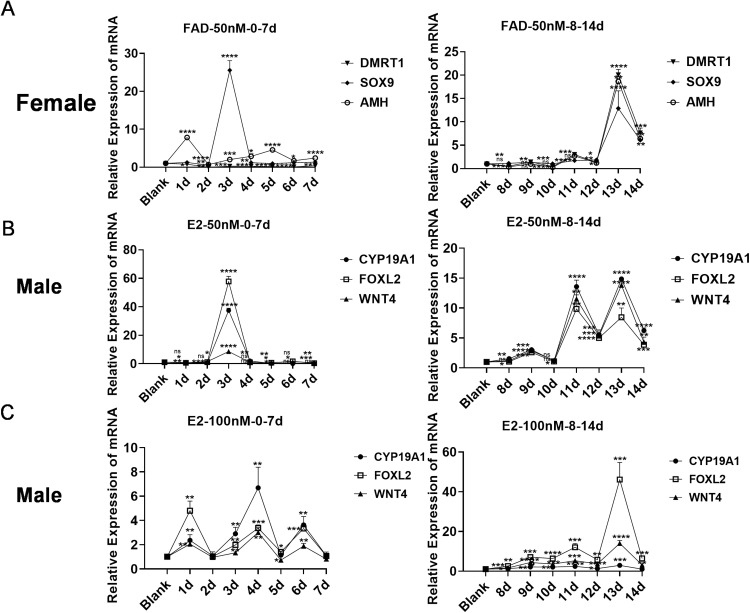
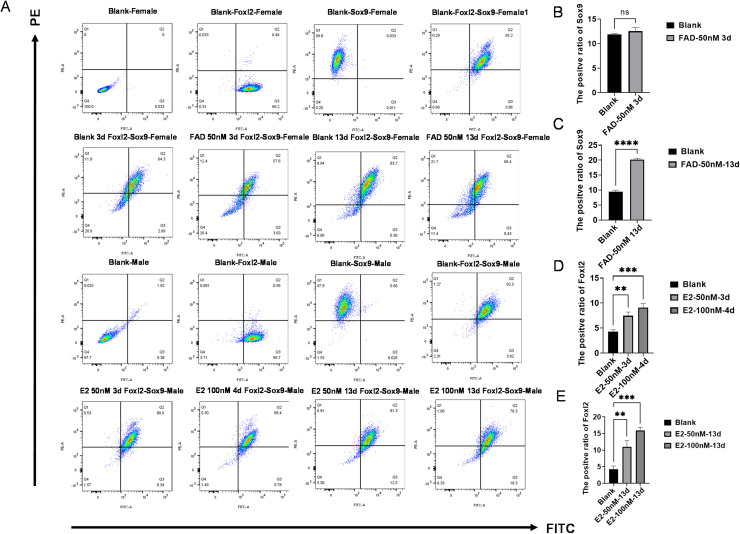
In chickens, sex determination is governed by genetic-hormonal interactions, but the dynamic interplay between sex hormones and receptor expression in gonadal somatic cells remains unclear. Here, we established an in vitro sex reversal model using embryonic chicken gonadal somatic cells (E18.5 days) to dissect temporal and dose-dependent regulatory mechanisms. Male (SOX9+) and female (FOXL2+) cells were isolated via two-step enzymatic digestion and maintained sex-specific markers in culture. Hormonal treatments revealed distinct phenotypic plasticity: Short-term (3 days) 50 nM fadrozole (FAD) in female cells upregulated male markers (SOX9, AMH; P < 0.001), while prolonged (13 days) exposure induced an intersex state with co-expression of male/female genes (P < 0.01). In male cells, 50 nM estradiol (E2) induced bisexual characteristics within 3 days (P < 0.0001), and 100 nM E2 triggered sex reversal by day 4 (CYP19A1, FOXL2, WNT4; P < 0.01), though extended treatment reverted to an intersex phenotype. Flow cytometry validated hormone-induced protein-level changes in sex-related genes. Receptor dynamics showed oscillatory patterns: In female cells, 50 nM FAD transiently activated ESR1 (0-7 days), inhibited ESR2/AR, and induced AR-dependent male gene expression at 8-13 days. In male cells, E2 (50/100 nM) repressed AR expression for 14 days while phase-activating ESR1/ESR2; early AR inhibition correlated with male gene peaks, whereas ESR1/ESR2 fluctuations drove female gene activation. These findings define temporal thresholds in avian sex determination, highlighting receptor-driven sexual plasticity. Elucidating this genetic-hormonal crosstalk provides a framework for optimizing avian sex control strategies.
Keywords: Chicken; Gonadal somatic cell; Sex differentiation; Sex reversal.
Copyright © 2025. Published by Elsevier Inc.
Conflict of interest statement
Disclosures The authors declare that they have no conflicts of interest.
Figures


Similar articles
-
Multi-omics analysis of yolk and allantoic fluid in chicken embryonic development and sexual differentiation.Poult Sci. 2025 Aug;104(8):105349. doi: 10.1016/j.psj.2025.105349. Epub 2025 May 28. Poult Sci. 2025. PMID: 40494175 Free PMC article.
-
Reprograming skin fibroblasts into Sertoli cells: a patient-specific tool to understand effects of genetic variants on gonadal development.Biol Sex Differ. 2024 Mar 22;15(1):24. doi: 10.1186/s13293-024-00599-y. Biol Sex Differ. 2024. PMID: 38520033 Free PMC article.
-
Transcriptome analysis reveals the sex-switching mechanism of juvenile hermaphroditism in silver pomfret (Pampus argenteus).Biol Sex Differ. 2025 Jul 14;16(1):51. doi: 10.1186/s13293-025-00736-1. Biol Sex Differ. 2025. PMID: 40660379 Free PMC article.
-
Sex determination and gonadal sex differentiation in the chicken model.Int J Dev Biol. 2018;62(1-2-3):153-166. doi: 10.1387/ijdb.170319cs. Int J Dev Biol. 2018. PMID: 29616724 Review.
-
Systemic pharmacological treatments for chronic plaque psoriasis: a network meta-analysis.Cochrane Database Syst Rev. 2021 Apr 19;4(4):CD011535. doi: 10.1002/14651858.CD011535.pub4. Cochrane Database Syst Rev. 2021. Update in: Cochrane Database Syst Rev. 2022 May 23;5:CD011535. doi: 10.1002/14651858.CD011535.pub5. PMID: 33871055 Free PMC article. Updated.
References
-
- Algothmi K.M., Mahasneh Z.M.H., Abdelnour S.A., Khalaf Q.A.W., Noreldin A.E., Barkat R.A., Khalifa N.E., Khafaga A.F., Tellez-Isaias G., Alqhtani A.H., Swelum A.A., Abd El-Hack M.E. Protective impacts of mitochondria enhancers against thermal stress in poultry. Poult. Sci. 2024;103(1) - PMC - PubMed
-
- Baumbach J.L., Zovkic I.B. Hormone-epigenome interactions in behavioural regulation. Horm. Behav. 2020;118 - PubMed
-
- Bhandari R.K., Nakamura M., Kobayashi T., Nagahama Y. Suppression of steroidogenic enzyme expression during androgen-induced sex reversal in Nile tilapia (Oreochromis niloticus) Gen. Comp. Endocrinol. 2006;145(1):20–24. - PubMed
-
- Brown N.L., Baylé J.D., Scanes C.G., Follett B.K. Chicken gonadotrophins: their effects on the testes of immature and hypophysectomized japanese quail. Cell Tissue Res. 1975;156(4):499–520. - PubMed
MeSH terms
Substances
LinkOut - more resources
Full Text Sources
Research Materials
Miscellaneous
