

Predicting and explaining high dead-on-arrival outcomes in meat-type ducks using deep learning: A path to improved welfare management
- PMID: 40541105
- PMCID: PMC12221627
- DOI: 10.1016/j.psj.2025.105439
Predicting and explaining high dead-on-arrival outcomes in meat-type ducks using deep learning: A path to improved welfare management
Abstract
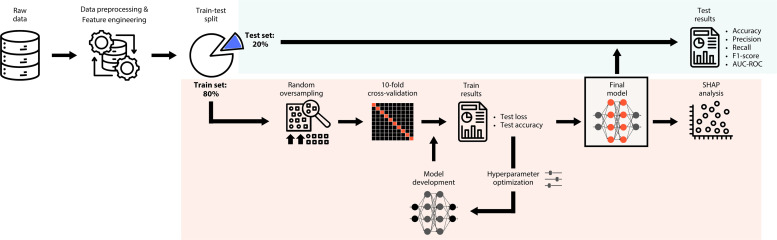
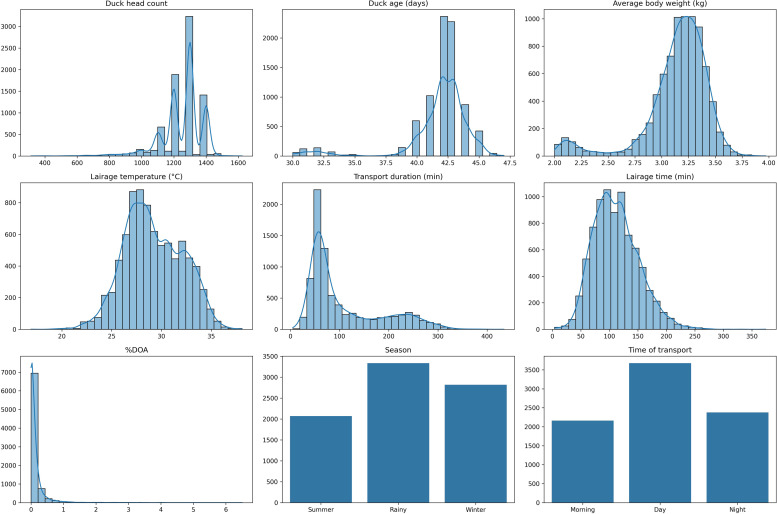
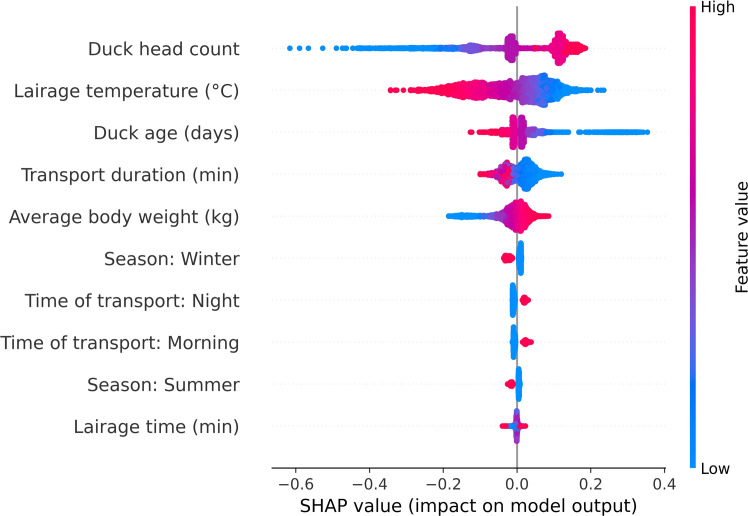
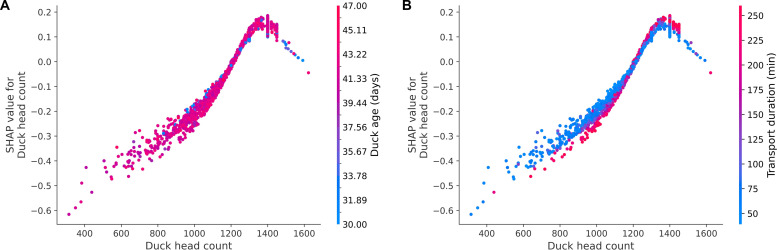
Dead-on-arrival (DOA) rates are a critical welfare and economic concern in poultry production, reflecting the cumulative impact of handling, transport, and lairage conditions on bird mortality. Compared to broilers and layers, meat-type ducks have received less attention in DOA research, despite their distinct physiological responses to preslaughter stressors and increasing relevance in commercial poultry production. Although machine learning models have been widely applied for DOA prediction, their limited transparency can hinder practical application in real-world settings. This study analyzed 8220 truckload entries of meat-type ducks recorded between 2022 and 2023, with the objective of developing an explainable deep learning model to predict high DOA outcomes using preslaughter management and environmental data. Deep learning models, owing to their complex architecture, offer superior predictive capacity and can capture nonlinear interactions in high-dimensional datasets. To enhance model interpretability and support practical application, SHapley Additive exPlanations (SHAP) was applied to identify the most influential predictors of DOA classification. The final model demonstrated strong classification performance, with an accuracy of 80.29 %, precision of 79.25 %, recall of 80.29 %, F1-score of 79.66 %, and an AUC-ROC of 76.03 %. Key predictors of high DOA included duck head count, lairage temperature, duck age, and transport duration. Notably, a higher number of ducks per truckload was strongly associated with elevated DOA risk (i.e., truckloads classified in the high DOA group), along with lairage temperatures and duck ages below the respective medians. Additionally, shorter transport durations were linked to increased mortality, highlighting the complex interplay of preslaughter stressors. By leveraging SHAP analysis, this study provided both global and local interpretability, ensuring that model outputs were not only accurate but also explainable. These findings support precision-driven preslaughter interventions, enabling industry stakeholders to optimize handling, transport, and lairage practices to reduce mortality rates and enhance duck welfare.
Keywords: Dead on arrival; Deep learning; Duck welfare; Meat-type duck; SHAP analysis.
Copyright © 2025. Published by Elsevier Inc.
Conflict of interest statement
Declaration of competing interest We declare that we have no conflicts of interest. The funder of this study had no role in the study design, data collection, analysis, or interpretation of the data. Additionally, the funder did not influence the decision to publish the results or the preparation of the manuscript. All views expressed in this publication are solely those of the authors.
Figures


Similar articles
-
Supervised Machine Learning Models for Predicting Sepsis-Associated Liver Injury in Patients With Sepsis: Development and Validation Study Based on a Multicenter Cohort Study.J Med Internet Res. 2025 May 26;27:e66733. doi: 10.2196/66733. J Med Internet Res. 2025. PMID: 40418571 Free PMC article.
-
Advanced Prediction of Heart Failure Risk in Elderly Diabetic and Hypertensive Patients Using Nine Machine Learning Models and Novel Composite Indices: Insights from NHANES 2003-2016.Eur J Prev Cardiol. 2025 Feb 27:zwaf081. doi: 10.1093/eurjpc/zwaf081. Online ahead of print. Eur J Prev Cardiol. 2025. PMID: 40036490
-
Cost-effectiveness of using prognostic information to select women with breast cancer for adjuvant systemic therapy.Health Technol Assess. 2006 Sep;10(34):iii-iv, ix-xi, 1-204. doi: 10.3310/hta10340. Health Technol Assess. 2006. PMID: 16959170
-
Health professionals' experience of teamwork education in acute hospital settings: a systematic review of qualitative literature.JBI Database System Rev Implement Rep. 2016 Apr;14(4):96-137. doi: 10.11124/JBISRIR-2016-1843. JBI Database System Rev Implement Rep. 2016. PMID: 27532314
-
The clinical effectiveness and cost-effectiveness of enzyme replacement therapy for Gaucher's disease: a systematic review.Health Technol Assess. 2006 Jul;10(24):iii-iv, ix-136. doi: 10.3310/hta10240. Health Technol Assess. 2006. PMID: 16796930
References
-
- Benincasa N.C., Sakamoto K.S., Silva I.J.O.d., Lobos C.M.V. Animal welfare: impacts of pre-slaughter operations on the current poultry industry. J. Anim. Behav. Biometeorol. 2020;8:104–110.
-
- Bianchi M., M P., Claudio C. Effects of transport and lairage on mortality, liveweight loss and carcass quality in broiler chickens. Ital. J. Anim. Sci. 2005;4:516–518.
-
- Caffrey N.P., Dohoo I.R., Cockram M.S. Factors affecting mortality risk during transportation of broiler chickens for slaughter in Atlantic Canada. Prev. Vet. Med. 2017;147:199–208. - PubMed
LinkOut - more resources
Full Text Sources
