. 2025 Aug 21;188(17):4640-4657.e30.
doi: 10.1016/j.cell.2025.05.031. Epub 2025 Jun 19.

Cholinergic neuronal activity promotes diffuse midline glioma growth through muscarinic signaling

Affiliations

Cholinergic neuronal activity promotes diffuse midline glioma growth through muscarinic signaling

Richard Drexler et al. Cell. .

Abstract

Glutamatergic neuronal activity promotes proliferation of both oligodendrocyte precursor cells (OPCs) and gliomas, including diffuse midline glioma (DMG). However, the role of neuromodulatory brainstem neurons projecting to midline structures where DMGs arise remains unexplored. Here, we demonstrate that midbrain cholinergic neuronal activity modulates OPC and DMG proliferation in a circuit-dependent manner. Optogenetic stimulation of the cholinergic pedunculopontine nucleus (PPN) promotes glioma growth in pons, while stimulation of the laterodorsal tegmentum nucleus (LDT) drives proliferation in thalamus. DMG-bearing mice exhibit higher acetylcholine release and increased cholinergic neuronal activity over the disease course. In co-culture, cholinergic neurons enhance DMG proliferation, and acetylcholine directly acts on DMG cells. Single-cell RNA sequencing revealed high CHRM1 and CHRM3 expression in primary DMG samples. Pharmacological or genetic blockade of M1/M3 receptors abolished cholinergic activity-driven DMG proliferation. Taken together, these findings demonstrate that midbrain cholinergic long-range projections promote activity-dependent DMG growth, mirroring a parallel proliferative effect on healthy OPCs.

Keywords: DMG; LDT; OPC; PPN; cholinergic neuron; diffuse midline glioma; glioma; laterodorsal tegmentum nucleus; neuron; neuron-glioma; neuronal activity; oligodendrocyte; oligodendrogenesis; pedunculopontine nucleus.


Conflict of interest statement

Declaration of interests M.M. and K.D. hold equity in Maplight Therapeutics and Stellaromics. K.D. is a founder and consultant for MapLight Therapeutics and Stellaromics. R.D., A.D., A.G., K.D., and M.M. are inventors on a patent application for treating central nervous system tumors using muscarinic receptor antagonists. K.D. is a consultant for Modulight.bio and RedTree.

Figures
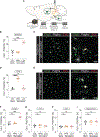
Figure 1.
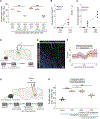
Figure 1.. Cholinergic neuronal activity-regulated modulation of oligodendrocyte precursor cells
(A) Schematic of experimental paradigm for optogenetic stimulation of cholinergic neurons in either laterodorsal tegmentum nucleus (LDT) or pedunculopontine nucleus (PPN). (B) Optogenetic stimulation of cholinergic neurons in LDT increases OPC proliferation (EdU+/Pdgfra+) in thalamus (CTL [not stimulated], PPN stimulated, and LDT stimulated, n = 5 mice/group). One-way analysis of variance (ANOVA) with Tukey’s post hoc analysis; ***p < 0.001, ns: non-significant. Data = mean ± SEM. (C) Confocal micrographs show thalamic OPC response after LDT stimulation. Olig2, green; Pdgfra, white; EdU, red, scale bars, 50 μm (left image) and 20 μm (right image). (D) Optogenetic stimulation of cholinergic neurons in PPN increases OPC proliferation (EdU+/Pdgfra+) in pons (CTL, PPN, and LDT, n = 5 mice). One-way ANOVA with Tukey’s post hoc analysis; ***p < 0.001, ns, non-significant. Data = mean ± SEM. (E) Confocal micrographs show pontine OPC response after PPN stimulation. Olig2, green; Pdgfra, white; EdU, red, scale bars, 50 μm (left image) and 20 μm (right image). (F–I) OPC response in (F) prefrontal cortex, (G) ventral tegmental area, (H) nucleus accumbens, and (I) hippocampus (CTL, PPN, and LDT, n = 5 mice/group). One-way ANOVA with Tukey’s post hoc analysis; **p < 0.01, ns, non-significant. Data = mean ± SEM. Related to Figures S1 and S2.
Figure 2.
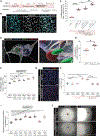
Figure 2.. Cholinergic neuronal activity-mediated DMG proliferation
(A) Schematic of experimental paradigm for optogenetic stimulation of cholinergic neurons in either LDT or PPN in mice bearing H3K27M DMG. (B) Proliferation index (EdU+/GFP+) of thalamic allografts in mice either stimulated in PPN or LDT or mock-stimulated (‘‘CTL’’) (CTL, PPN, and LDT, n = 5 mice/group). One-way analysis of variance (ANOVA) with Tukey’s post hoc analysis; ****p < 0.0001, ns, non-significant. Data = mean ± SEM. (C) Proliferation index (EdU+/GFP+) of pontine allografts in mice either stimulated in PPN or LDT or mock-stimulated (CTL) (CTL, PPN, and LDT, n = 5 mice/group). One-way ANOVA with Tukey’s post hoc analysis; ****p < 0.0001, ns, non-significant. Data = mean ± SEM. (D) Confocal micrographs showing proliferating GFP+ tumor cells in mock-stimulated (CTL) (upper images) and LDT-stimulated (‘‘LDT’’) (bottom images) mice. GFP, green; EdU, red, scale bars, 100 μm. (E) Schematic of experimental paradigm for xenografting with optogenetic stimulation of either LDT or PPN in immunodeficient mice. (F) Proliferation index (EdU+/HNA+) of pontine xenografts in mice either stimulated in PPN or LDT or mock-stimulated (‘‘Mock’’) (Mock, PPN, and LDT, n = 5 mice/group). One-way ANOVA with Tukey’s post hoc analysis; ****p < 0.0001, ns: non-significant. Data = mean ± SEM. (G) Confocal micrographs illustrate proliferating HNA+ glioma cells in mock-stimulated (Mock) (upper images) and PPN-stimulated (‘‘PPN’’) (bottom images) mice after xenografting into pons. HNA, green; EdU, red; scale bars, 100 μm. (H) Proliferation index (EdU+/HNA+) of thalamic xenografts in mice either stimulated in PPN or LDT or mock-stimulated (Mock) (Mock, PPN, n = 4 mice/group; and LDT, n = 5 mice/group). One-way ANOVA with Tukey’s post hoc analysis; ***p < 0.001, ns: non-significant. Data = mean ± SEM. (I) Fiber photometry recordings showing averaged GCaMP-labeled calcium transients in thalamic glioma cells with simultaneous mock (n = 4 mice), LDT (n = 6 mice), and PPN (n = 3 mice) stimulation. (J) AUC of fiber photometry recordings from (I) before, during, and after stimulation of the cholinergic nuclei. One-way ANOVA with Tukey’s post hoc analysis; **p < 0.01, *p < 0.05, ns: non-significant. Data = mean ± SEM. Related to Figures S3 and S4.
Figure 3.
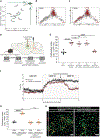
Figure 3.. Mechanisms of activity-regulated midbrain cholinergic neuron-to-glioma signaling
(A) Quantification of glioma cell proliferation (EdU+/HNA+) in DMG cells exposed to conditioned medium (CM) from LDT or PPN midbrain explants following cholinergic neuronal optogenetic stimulation. One-way analysis of variance (ANOVA) with Tukey’s post hoc analysis; **p < 0.01, ***p < 0.001. Data = mean ± SEM; n = three independent experiments, each with three wells per condition; each data point represents the mean of three wells per condition for a given experiment. (B and C) Measurement of BDNF and acetylcholine levels in midbrain explant CM from (B) LDT and (C) PPN. Data = mean ± SEM; n = three independent experiments, each with three wells per condition; each data point represents the mean of three wells per condition for a given experiment. (D and E) Schematic of the experimental paradigm and representative image showing the recording site for GRAB-ACh3.0 sensor experiment, performed to measure acetylcholine release in the peritumoral microenvironment of thalamic allografts. ACh3.0, green; DAPI, blue; scale bar, 50 μm. (F) Average GRAB-ACh3.0 fluorescence at the 4-week time point following thalamic allograft implantation (n = 6 mice). (G) Schematic of the experimental paradigm used to assess the local effects of BDNF-TrkB signaling in activity-regulated cholinergic neuron-to-glioma signaling in the midbrain. (H) Proliferation index (EdU+/HNA+) of DMGallografts in the PPN in mice with PPN optogenetic stimulation and treated with either vehicle or entrectinib delivered locally to the tumor (n = 4 mice/group). One-way ANOVA with Tukey’s post hoc analysis; ****p < 0.0001, **p < 0.01, ns: non-significant. Data = mean ± SEM. Related to Figures S5 and S6.
Figure 4.
Figure 4.. Direct effects of acetylcholine on DMG
(A) Timeline for the generation of iPSC-derived cholinergic with viral transduction (AAV-VAChTe1-ChRmine::eYFP or AAV-VAChTe1::eYFP) for co-culturing with glioma cells. (B) Confocal micrographs showing cholinergic motor neurons generated hiPSCs of a healthy 12-year-old male and co-cultured with DMG cells of an 8-year old male. NF-H/M, turquoise; H3K27M, white; scale bars, 50 μm. (C) Quantification of glioma cell proliferation (EdU+/H3K27M+) when co-cultured with hiPSC-derived cholinergic motor neurons paired with in vitro optogenetic stimulation. One-way analysis of variance (ANOVA) with Tukey’s post hoc analysis; ****p < 0.0001, **p < 0.01, ns: non-significant. Data = mean ± SEM; n = four independent experiments, each with three wells per condition; each data point represents the mean of three wells per condition for a given experiment. (D) Three-dimensional rendering illustrating presynaptic cholinergic neuron (NF-H/M: white) with presynaptic puncta (VAChT: green) co-localizing with postsynaptic puncta (CHRM1/3: red) expressed by post-synaptic glioma cell (H3K27M: blue) in a cholinergic neuron-DMG co-culture. Scale bars, 2 μm. (E) Co-localization of VAChT (presynaptic cholinergic neurons, indicated by NF-H/M+) and CHRM1/3 (post-synaptic glioma cells, indicated by H3K27M+) in the DMG cell line when co-cultured with hiPSC-derived cholinergic motor neurons. Unpaired two-tailed Welch’s t test; *p < 0.05. Data = mean ± SEM; n = four independent experiments, each with three wells per condition; each data point represents the mean of three wells per condition for a given experiment. (F) Proliferation index (EdU+/DAPI+) of a patient-derived DMG cell line (SU-DIPG17) after exposure to different concentrations of acetylcholine. One-way ANOVA with Tukey’s post hoc analysis; **p < 0.01, *p < 0.05, ns: non-significant. Data = mean ± SEM; n = three independent experiments, each with three wells per condition; each data point represents the mean of three wells per condition for a given experiment. (G) Representative confocal micrographs showing the proliferation of a patient-derived cell line after exposure to vehicle control (top image) or 5 μM acetylcholine (bottom image). DAPI, blue; EdU, red; scale bars, 100 μm. (H) Proliferation index (EdU+/DAPI+) of a patient-derived cell line (SU-DIPG17) after exposure to various muscarinic and nicotinic receptor agonists (nicotine and muscarine) and antagonists (mecamylamine and scopolamine). One-way ANOVA with Tukey’s post hoc analysis; **p < 0.01, ns: non-significant. Data = mean ± SEM; n = three independent experiments, each with three wells per condition; each data point represents the mean of three wells per condition for a given experiment. (I) 3D migration assay analysis. One-way ANOVA with Tukey’s post hoc analysis; *p < 0.05, **p < 0.01. Data = mean ± SEM; n = three independent experiments, each with three wells per condition; each data point represents the mean of three wells per condition for a given experiment. (J) Representative images showing the glioma cell migration at timepoint zero and after 72 h. Scale bars, 1,000 μm. Related to Figures S7 and S8.
Figure 5.
Figure 5.. CHRM1 and CHRM3 mediate the effects of cholinergic neuronal activity in pontine and thalamic DMG
(A) Scatter plot correlating cholinergic receptor gene expression values with an OPC-like score in DMG samples. (B) Two-dimensional representation of the association between CHRM1 expression (red dots: centered value > 1) and the OPC-like (y axis) as well as OC-like and AC-like (x axis) scores for H3K27M DMGs. (C) Two-dimensional representation of the association between CHRM3 expression (red dots: centered value > 1) and the OPC-like (y axis) as well as OC-like and AC-like (x axis) scores for H3K27M DMGs. (D) Schematic of the experimental paradigm for local antagonism of muscarinic receptors M1 and M3 in thalamic allografts. (E) Proliferation index (EdU+/GFP+) of thalamic allografts in mice optogenetically stimulated in LDT or mock-stimulated controls, with or without administration of M1 (VU0255035) or M3 receptors (4-DAMP) pharmacological inhibitors. ‘‘Mock,’’ ‘‘Vehicle,’’ and ‘‘M1/M3 inhibition’’ n = 5 mice/group; ‘‘M1 inhibition’’ and ‘‘M3 inhibition’’ n = 4 mice/group. One-way analysis of variance (ANOVA) with Tukey’s post hoc analysis; ****p < 0.0001, ns: non-significant. Data = mean ± SEM. (F) Fiber photometry recordings showing averaged GCaMP-labeled calcium transients in thalamic glioma cells with simultaneous LDT stimulation and either local vehicle or CHRM1/3 antagonist infusion (n = 4 mice/group). (G) Proliferation index (EdU+/HNA+) of pontine xenografts in mice optogenetically stimulated in the PPN or mock-stimulated controls, with either control (Cas9-expressing) patient-derived DMG cells (DIPG17) or dual CHRM1/3 CRISPR-mediated knockout (DIPG17-CHRM1/3-KO). ‘‘DIPG17’’ n = 4 mice/group; ‘‘DIPG17-CHRM1/3-KO’’ n = 5 mice/group. One-way ANOVA with Tukey’s post hoc analysis; ****p < 0.0001, ns: not significant. Data = mean ± SEM. (H) Confocal micrographs showing proliferating HNA+ tumor cells in the pons of either control (Cas9-expressing) patient-derived DMG cells (DIPG17) or dual CHRM1/3 CRISPR-mediated knockout cells (DIPG17-CHRM1/3-KO) in PPN-stimulated mice. HNA, green; EdU, red, scale bars, 50 μm. Related to Figures S10.
Figure 6.
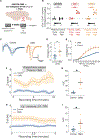
Figure 6.. Diffuse midline glioma increases midbrain cholinergic neuronal activity
(A) Schematic of experimental paradigm for investigating reciprocal signaling effects of tumor cells to midbrain cholinergic neurons. (B) Neuronal activity (cFos+/ChAT+ neurons) in LDT and PPN of pontine tumor-bearing mice when compared with control-injected mice (n = 5 mice/group). Unpaired two-tailed Welch’s t test; ***p < 0.001, ns: non-significant. Data = mean ± SEM. (C) The sample trace shows the output field potential comparison between the control and DMG-bearing mice. (D and E) sEPSCs (D) were recorded from cholinergic neurons within the LDT. Population data show a significant increase in sEPSC frequency in MADR-bearing mice compared with control-injected mice (MADR: 2.0 ± 0.29 Hz, n = 12, 5 mice; Control 1.1 ± 0.18 Hz, n = 22, 6 mice). Data shown as mean, error bars indicate SEM; p = 0.0083 (α = 0.05). Statistical analysis was performed using a two-tailed nonparametric t test with Mann-Whitney correction. fEPSC (E) data were compared between control and DMG-bearing mice, revealing a significant increase in output field potentials in MADR mice compared to controls (two-way ANOVA mixed-effect analysis, p <0.0001, α = 0.05). (F) Average GRAB-ACh3.0 fluorescence in the peritumoral environment at the 2-week time point following thalamic implantation of DMG (orange line, n = 7 mice) or control cells (blue line, n = 5 mice). (G) AUC of GRAB-ACh3.0 recordings from (F) of DMG or control-injected animals. Unpaired two-tailed Welch’s t test; *p < 0.05. Data = mean ± SEM. (H) Fiber photometry recordings showing averaged GCaMP-labeled calcium transients in cholinergic neurons of LDT and PPN from DMG (n = 8 mice) or control-injected (n = 7 mice) animals. Measured fluorescence is combined from both the LDT and PPN. (I) AUC of fiber photometry recordings from (H) in DMG or control-injected animals. Measured fluorescence is combined from both the LDT and PPN. Unpaired two-tailed Welch’s t test; *p < 0.05. Data = mean ± SEM. Related to Figure S11.

Update of

References

    1. Monje M, Borniger JC, D’Silva NJ, Deneen B, Dirks PB, Fattahi F, Frenette PS, Garzia L, Gutmann DH, Hanahan D, et al. (2020). Roadmap for the Emerging Field of Cancer Neuroscience. Cell 181, 219–222. 10.1016/j.cell.2020.03.034. - DOI - PMC - PubMed
    1. Mancusi R, and Monje M (2023). The neuroscience of cancer. Nature 618, 467–479. 10.1038/s41586-023-05968-y. - DOI - PMC - PubMed
    1. Winkler F, Venkatesh HS, Amit M, Batchelor T, Demir IE, Deneen B, Gutmann DH, Hervey-Jumper S, Kuner T, Mabbott D, et al. (2023). Cancer neuroscience: State of the field, emerging directions. Cell 186, 1689–1707. 10.1016/j.cell.2023.02.002. - DOI - PMC - PubMed
    1. Pan Y, Hysinger JD, Barron T, Schindler NF, Cobb O, Guo X, Yalçın B, Anastasaki C, Mulinyawe SB, Ponnuswami A, et al. (2021). NF1 mutation drives neuronal activity-dependent initiation of optic glioma. Nature 594, 277–282. 10.1038/s41586-021-03580-6. - DOI - PMC - PubMed
    1. Chen P, Wang W, Liu R, Lyu J, Zhang L, Li B, Qiu B, Tian A, Jiang W, Ying H, et al. (2022). Olfactory sensory experience regulates gliomagenesis via neuronal IGF1. Nature 606, 550–556. 10.1038/s41586-022-04719-9. - DOI - PubMed