. 2025 Jun 19;13(6):e011442.
doi: 10.1136/jitc-2024-011442.

HVJ-E links Apolipoprotein d to antitumor effects

Affiliations

HVJ-E links Apolipoprotein d to antitumor effects

Airi Ishibashi et al. J Immunother Cancer. .

Abstract

Background: Virotherapy eradicates tumors by directly killing cancer cells and causing adjuvant effects. However, the mechanism by which non-replicating virotherapy exerts anti-tumor effects is unclear.

Methods: In this study, we investigated the genes that mediate the anti-tumor effects of ultraviolet (UV)-irradiated Hemagglutinating Virus of Japan envelope (HVJ-E) using RNA sequencing, gene knockout, and a drug-inducible gene expression system. We examined the antitumor effects of Apolipoprotein d (Apod) using genome-wide CRISPR library screening, in situ biotinylation combined with mass spectrometry, flow cytometry, biochemistry, and tumor-bearing mouse models.

Results: Here, we show that HVJ-E represses tumor growth via Irf7-induced Apod expression in tumor cells in vivo. Irf7 in B16F10 cells is a pivotal transcription factor for HVJ-E-induced anti-tumor effects. Apod substantially suppresses tumor growth even in HVJ-E-insensitive tumors. Apod is required to increase NKG2D-ligand genes in HVJ-E-treated tumors. Genome-wide CRISPR library screening and in situ biotinylation of Apod reveal an association of Apod with ERK2. Mechanistically, Apod prevents the nuclear translocation of ERK2 and Importin7, increasing NKG2D-ligands expression in B16F10 cells and attenuating tumor growth. Treating a local tumor with a combination therapy of Apod with the anti-OX40, T cell costimulatory molecule, antibody substantially repressed tumor growth in target and non-target lesions alongside T cell activation.

Conclusion: Our findings provide insights into the molecular mechanisms of how HVJ-E induces anti-tumor effects and can aid the development of therapeutic strategies for eliciting anti-tumor immunity.

Keywords: Abscopal; Oncolytic virus; co-stimulatory molecules.


Conflict of interest statement

Competing interests: KN and AI applied for a patent based on the study with Osaka University.

Figures

Figure 1
Figure 1. HVJ-E-induced antitumor effects require Irf7 expression in B16F10 tumors. (a) Heatmap of gene expression data in B16F10 tumors, showing genes with log2 fold change >4, expression >8 in the HVJ-E group, and p<0.01. (b) Box plot of relative tumor volume of two independent clones in each KO B16F10 cell line. Relative tumor volume showing the ratio of HVJ-E-treated tumor volume to PBS-treated tumor volume at day 14. P value was calculated by Steel’s test compared with the wild type group. Gray dots show each relative HVJ-E-treated tumor volume. The black dot indicates an outlier. Number of samples is shown in online supplemental figure S3. 2,000 hemagglutination units HVJ-E were intratumorally injected three times every 2 days. Apod, apolipoprotein d; Apol9a, apolipoprotein L9a; Apol9b, apolipoprotein L9b; HVJ, hemagglutinating virus of Japan; IFNR, Interferon Alpha And Beta Receptor; IRF, interferon regulatory factor; KO, knockout; PBS, phosphate buffered saline; RLR, RIG-I-like receptors; WT, wild-type.
Figure 2
Figure 2. Irf7 expression represses B16F10 tumor growth through Apod expression. (a) A schema of the tetracycline-inducible expression DNA cassette in the Gt(Rosa)26Sor locus. rtTA, reverse tetracycline-controlled TransActivator; TRE3GS, Tet Response Element sequence; pause site, transcription block sequence. The TRE3GS promoter drives GFP and GFP-Irf7 expression. (b) The growth curve of B16F10 cells containing tetracycline-inducible GFP (Tet GFP) and Tet GFP-Irf7. 200 µL of 2 mg/mL doxycycline was orally administrated on the indicated days. P values were calculated using Student’s t-test. (c) Volcano plot of gene expression in HVJ-E-treated wild-type (WT) B16F10 cells and Irf7 KO B16F10 cells in vivo. The red dots show genes with significantly altered expression in the HVJ-E-treated B16F10 WT cells compared with PBS-treated B16F10 WT. Gene names are shown for genes with log2 fold change >2 between the HVJ-E-treated WT B16F10 and the HVJ-E-treated Irf7 KO B16F10 cells. x-axis, log2 fold change between the HVJ-E-treated WT B16F10 and the HVJ-E-treated Irf7 KO B16F10; y-axis, −log10 (p value). (d) Dot plot of relative Apod expression in the indicated plasmids-transfected cells, normalized to 18S (n=3). P values were calculated using the Tukey HSD. Error bars show the SD. (e) Dot plot of gene expression data in Apod KO B16F10 tumors. Tumor cells were collected 1 day after three doses of 2,000 hemagglutination units HVJ-E or PBS from GFP mice, and immune cells were depleted from the tumor cells using GFP by flow cytometry. The red dots show genes with significantly changed expression. y and x axes show log2 fold change. (f) Heatmap of NKG2D-ligands and major histocompatibility complex class I/II gene expression in PBS or HVJ-E-treated WT and Apod KO B16F10 tumors. (n=3). Apod, apolipoprotein d; GFP, Green fluorescent protein; HSD, honestly significant difference; HVJ, hemagglutinating virus of Japan; IRF, interferon regulatory factor; KO, knockout; PBS, phosphate buffered saline; RLR, RIG-I-like receptors.
Figure 3
Figure 3. Apod is associated with tumor growth repression. (a) Tumor growth curve of B16F10 cells containing tetracycline-inducible GFP-Apod in C57BL/6N mice. (b) Gene set enrichment distribution in doxycycline-treated B16F10 cells with Tet GFP-Apod in comparison to control treatment in vivo. The representative gene ontologies with significant differences (adjusted p value<0.05) in Tet GFP-Apod are shown. (c) CBB-stained SDS-PAGE gel of recombinant Apod protein purified from Expi293 cells using HiTrap DEAE and HisTrap HP columns. The protein size was the same as the expected size. (d) Tumor growth curve of B16F10 cells after murine Apod protein intratumoral injection every other day. P values were calculated using Turkey’s HSD test. (e) Tumor growth curve of LL/2 cells. 2,000 hemagglutination units HVJ-E were intratumorally injected on days 0, 2, and 4. (f) Dot graph of the percentage of sequencing reads assigned to the HVJ genome sequence in vivo. (n=3). (g) Tumor growth curve of LL/2 cells after intratumoral Apod protein injection every other day. (h) Kaplan-Meier curves of overall survival in the TCGA-SKCM dataset with APOD high or low expression divided at the median. TCGA-SKCM samples, including only cutaneous melanoma, were filtered to single data for a patient, metastasis, and no prior prognosis, resulting in 337 samples. P values were calculated using the log-rank test. (i) Tumor growth curve of MeWo cells with intratumoral injection of human APOD protein on the indicated days. (j) Tumor growth curve of serous adenocarcinoma patient-derived xenograft after intratumoral human APOD protein injection on the indicated days. P values were calculated using the Wilcoxon rank-sum test (i, j) and Welch’s t-test (a, e, g), according to the normality and variance of the data. Error bars show the SD. Apod, apolipoprotein d; CBB, Coomassie Brilliant Blue; GFP, Green fluorescent protein; HSD, honestly significant difference; HVJ, hemagglutinating virus of Japan; PBS, phosphate buffered saline; SDS-PAGE, sodium dodecyl sulfate–polyacrylamide gel electrophoresis; TCGA-SKCM, The Cancer Genome Atlas-skin cutaneous melanoma.
Figure 4
Figure 4. CRISPR screening and in situ biotinylation of Apod reveal an association of Apod with ERK2. (a) Schema of CRISPR screening of genes related to Apod-mediated repression of tumor growth. Tumor growth curve of B16F10 cells harboring CRISPR library mixed with B16F10 cells containing Tet GFP or Tet GFP-Apod in C57BL/6N mice. 200 µL of 2 mg/mL doxycycline was orally administrated. The number in parentheses indicates the number of samples. Error bars show the SD. (b) Dot plot of p value of the enriched gRNAs with messenger RNA expression level comparing Dox+ and Dox− in Tet GFP and Tet GFP-Apod cells (n=5). The red dot shows p<0.00001. (c) Table of enriched GOs in the data of in situ biotinylation of GFP-Apod using anti-GFP antibody. We considered proteins with fivefold enrichment in Dox-treated Tet GFP-Apod cells, comparing both proteins enriched with control IgG antibody in Dox-treated Tet GFP-Apod cells and anti-GFP antibody in Dox-treated Tet GFP cells (n=3). The enrichment of GOs was calculated with Metascape. (d) Western blotting of ERK1/2 in WT and Mapk1 KO B16F10 cells. H2B is a loading control. (e) Tumor growth curve of WT and Mapk1 KO B16F10 cells in C57BL/6N mice. The number in parentheses indicates the number of samples. Error bars show the SD. P values were calculated using the Tukey HSD. (f) Tumor growth curve of Mapk1 KO B16F10 cells in C57BL/6N mice. Apod (40 µg) was intratumorally injected. The number in parentheses indicates the number of samples. Error bars show the SD. (g) Dot plot showing NKG2D-L median expression in WT and Mapk1 KO B16F10 cells in PBS and Apod-treated tumors. The number in parentheses indicates the number of samples. (h) Immuno-staining of ERK1/2 in Apod-treated or HVJ-E-treated B16F10 tumors. Apod (40 µg) or HVJ-E (2,000 hemagglutination units) was intratumorally injected on days 0, 2, and 4. Tumors were analyzed 1 day after the final treatment. (i) Dot plot showing relative nuclear ERK signals compared with the whole cell area. The number in parentheses indicates the number of samples. P values were calculated using Welch’s t-test. Apod, apolipoprotein d; GO, gene ontology; GFP, Green fluorescent protein; HSD, honestly significant difference; HVJ, hemagglutinating virus of Japan; KO, knockout; PBS, phosphate buffered saline; WT, wild-type.
Figure 5
Figure 5. Apod increases NKG2D-L expression through preventing the nuclear translocation of ERK2. (a) Western blotting of proteins precipitated with Apod proteins using the indicated antibodies. (b) Western blotting of proteins fractionated to nuclear and cytoplasm in Apod-treated B16F10 cells using the indicated antibodies. The numbers indicate the ratio of the quantity of protein in the nuclear to that in the cytoplasm. (c) Western blotting of proteins precipitated with anti-ERK1/2 antibody in Tet GFP B16F10 cells treated with Dox− or Dox+. (d) Dot plot showing NKG2D-L median expression in Tet GFP B16F10 cells treated with Dox- or Dox+. n=3. (e) Western blotting of proteins precipitated with anti-ERK1/2 antibody in Tet GFP-Apod B16F10 cells treated with Dox− or Dox+. (f) Dot plot showing NKG2D-L median expression in Tet GFP-Apod B16F10 cells treated with Dox− or Dox+. n=3. (g) Western blotting of proteins fractionated to nuclear and cytoplasm in PD98059-treated B16F10 cells using the indicated antibodies. The numbers indicate the ratio of the quantity of protein in the nuclear to that in the cytoplasm. (h) Dot plot showing NKG2D-L median expression in 100 nM PD98059-treated or DMSO-treated B16F10 cells. n=3. (i) Western blotting of ERK1/2 in WT and Mapk3 KO B16F10 cells. H2B is a loading control. (j) Dot plot showing NKG2D-L median expression in PBS or Apod-treated Mapk3 KO B16F10 cells. n=3. (k) Western blotting of ERK1/2 in WT, Mapk1 KO, Mapk1 KO+EGFP, and Mapk1 KO+EGFP-Mapk1 B16F10 cells. H2B is a loading control. (l) Dot plot showing fold increases in NKG2D-L in Apod-treated B16F10 cells, compared with PBS-treated cells. n=3. P values were calculated using the Tukey HSD (l) and Student’s or Welch’s t-test (d, f, h, j), according to the normality and variance of the data. Apod, apolipoprotein d; GFP, Green fluorescent protein; HSD, honestly significant difference; HVJ, hemagglutinating virus of Japan; KO, knockout; NKG2D-L, NKG2D-ligands; PBS, phosphate buffered saline; WT, wild-type.
Figure 6
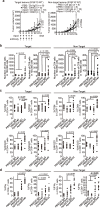
Figure 6. Apod+OX40 agonist antibody elicits abscopal antitumor effects by activating T cells. (a) Tumor growth curve of B16F10 cells in C57BL/6N mice. Apod (40 µg) was intratumorally injected with 10 µg anti-OX40 agonist or control antibody. The number in parentheses indicates the number of samples. Error bars show the SD. (b) Dot plot of the number of CD45/CD3/CD4 and CD45/CD3/CD8 T cells. PBS/Ctrl IgG, n=9; PBS/OX40 n=8; Apod/Ctrl IgG, n=10; Apod/OX40, n=9. (c) Percentage of CD94 and NKG2D expression in CD45/CD3/CD4 and CD45/CD3/CD8 T cells. Tumors were analyzed 14 days after treatment initiation. PBS/Ctrl IgG, n=9; PBS/OX40 n=8; Apod/Ctrl IgG, n=10; Apod/OX40, n=9. (d) Percentage of IFN-γ expression in CD45/CD3/CD4 and CD45/CD3/CD8 T cells after PMA ionomycin treatment. PBS/Ctrl IgG, n=8; PBS/OX40 n=8; Apod/Ctrl IgG, n=8; Apod/OX40, n=7. P values were calculated using the Tukey HSD (a), Steel-Dwass test (b), and Wilcoxon test (d), according to the normality and variance of the data. Apod, apolipoprotein d; HSD, honestly significant difference; IFN, interferon; PBS, phosphate buffered saline; PMA, phorbol myristate acetate; WT, wild-type.

References

    1. Davola ME, Mossman KL. Oncolytic viruses: how 'lytic' must they be for therapeutic efficacy? Oncoimmunology. 2019;8:e1581528. doi: 10.1080/2162402X.2019.1596006. - DOI - PMC - PubMed
    1. Li L, Liu S, Han D, et al. Delivery and Biosafety of Oncolytic Virotherapy. Front Oncol. 2020;10:475. doi: 10.3389/fonc.2020.00475. - DOI - PMC - PubMed
    1. Kiyohara E, Tanemura A, Nishioka M, et al. Intratumoral injection of hemagglutinating virus of Japan-envelope vector yielded an antitumor effect for advanced melanoma: a phase I/IIa clinical study. Cancer Immunol Immunother. 2020;69:1131–40. doi: 10.1007/s00262-020-02509-8. - DOI - PMC - PubMed
    1. Fujita K, Kato T, Hatano K, et al. Intratumoral and s.c. injection of inactivated hemagglutinating virus of Japan envelope (GEN0101) in metastatic castration-resistant prostate cancer. Cancer Sci. 2020;111:1692–8. doi: 10.1111/cas.14366. - DOI - PMC - PubMed
    1. Hammerich L, Marron TU, Upadhyay R, et al. Systemic clinical tumor regressions and potentiation of PD1 blockade with in situ vaccination. Nat Med. 2019;25:814–24. doi: 10.1038/s41591-019-0410-x. - DOI - PubMed

Substances

LinkOut - more resources