. 2025 Jul:117:105815.
doi: 10.1016/j.ebiom.2025.105815. Epub 2025 Jun 19.

MyD88 signalling in B cells and antibody responses during Oropouche virus-induced neurological disease in mice

Affiliations

MyD88 signalling in B cells and antibody responses during Oropouche virus-induced neurological disease in mice

Daniel Augusto Toledo-Teixeira et al. EBioMedicine. 2025 Jul.

Abstract

Background: Oropouche virus (OROV) is a neglected insect-borne orthobunyavirus that causes a febrile illness, neurological disease, and pregnancy complications in humans across an endemic area spanning South and Central America. The host factors associated with disease pathogenesis have nonetheless remained obscure, and little is known about the immune determinants of protection against OROV.

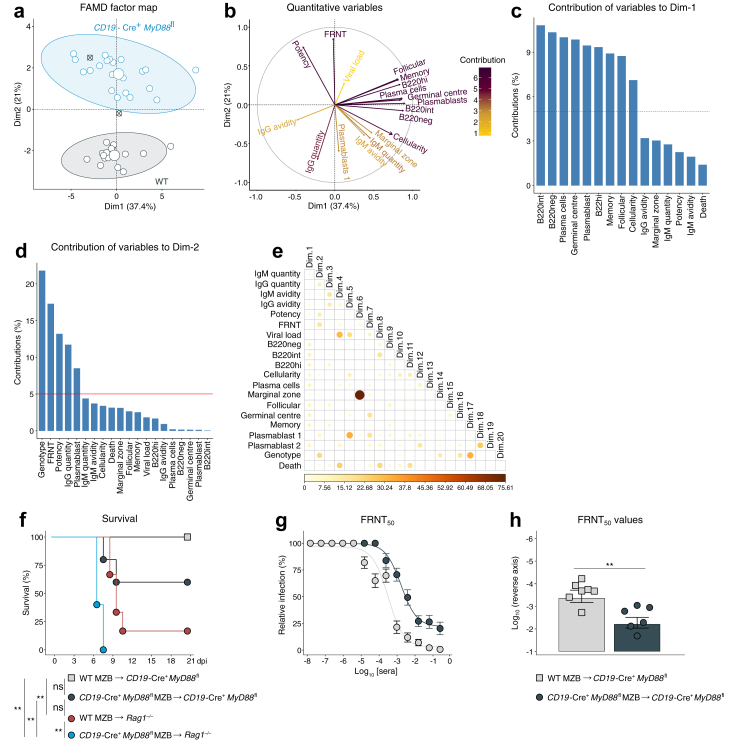
Methods: We tracked morbidity, mortality, viral loads, and serum neutralisation in wild-type (WT), Rag1-/-, CD19-Cre+Ifnarfl, and CD19-Cre+MyD88fl mice and performed immunophenotyping experiments, passive serum transfers, and adoptive cell transfers to determine how early antibody responses and B cell subsets control viral replication and dissemination to the central nervous system after infection with OROV.

Findings: In line with a protective role for B cells, WT mice efficiently produced OROV-specific antibodies within 6 days of infection. Serum transfer containing neutralising IgM from WT to Rag1-/- mice prevented neurological disease in OROV-challenged mice. CD19-Cre+MyD88fl mice but not CD19-Cre+Ifnarfl mice were vulnerable to neurological disease and produced lower titres of OROV-specific antibodies that exhibited suboptimal neutralisation and potency compared with MyD88-sufficient mice. CD19-Cre+MyD88fl mice also presented with reduced numbers of marginal zone B (MZB) cells and plasmablasts after infection, which were associated with high viral burdens and lethality. Adoptive transfer of MZB cells from WT mice protected CD19-Cre+MyD88fl mice and partially protected Rag1-/- mice from lethal infection with OROV.

Interpretation: Early MyD88 signalling in B cells is required for optimal antibody responses that limit viral replication and neurological disease in mice infected with OROV.

Funding: São Paulo Research Foundation (FAPESP), National Council for Scientific and Technological Development (CNPq), Coordination for the Improvement of Higher Education Personnel (CAPES), Unicamp Research Affairs Office, PIPAE University of São Paulo, Wellcome Trust, and National Institute of Science and Technology on Photonics Applied to Cell Biology (INFABIC, Unicamp).

Keywords: Emerging viruses; IgM; Innate immune response; Marginal zone B cells; Oropouche virus; Vector-borne diseases.


Conflict of interest statement

Declaration of interests MSD is an advisor or consultant for Moderna, Ocugen, Topspin Therapeutics, IntegerBio, MacroGenics, Inbios, Akagera Medicines, Merck, Bavarian Nordic, GlaxoSmithKline, and Vir Biotechnology. MSD has received unrelated funding via sponsored research agreements from Moderna, Emergent BioSolutions, Bavarian Nordic, and Vir Biotechnology. DAP has received unrelated funding via competitive awards from the Medical Research Council, the Open Medicine Foundation, the PolyBio Research Foundation, and the National Institute for Health Research.

Figures

Fig. 1
Fig. 1
Mortality, weight loss, morbidity, and viral loads for Rag1−/− mice after OROV infection. (a) Survival and (b) weight of C57BL/6 WT mice aged 4–6 weeks (grey, n = 14), Rag1−/− mice aged 4–6 weeks (red, n = 14), and Rag1−/− mice aged 9–12 weeks (orange, n = 14) over 21 days post-infection (dpi) with 105 FFU of OROV. Statistical differences were assessed using a log-rank test with Bonferroni correction (a). ∗∗∗∗p < 0.0001. (c) Clinical scores for Rag1−/− mice aged 4–6 weeks (n = 14) after OROV infection. Bars indicate the percent occurrence for each clinical score among all mice. Clinical scores were defined as follows: (1) active animal, no disease; (2) slow walking, slightly closed eyes, or slight impairment of balance; (3) apathy, ataxia, closed eyes, severe impairment of balance, circular walking, lethargy, or paralysis; or (4) moribund or deceased animal. (d–j) Viral loads in serum and tissues from infected Rag1−/− mice (red, n = 8 at each time point) and WT mice (grey, n = 8 at each time point) measured via focus-forming assay (circles correspond to left y-axis) or RT-qPCR (squares correspond to right y-axis). Statistical differences were assessed using the Kruskal–Wallis test with Dunn’s post-hoc test for each group versus day 1 post-infection. ∗p < 0.05, ∗∗p < 0.01, ∗∗∗p < 0.001, ∗∗∗∗p < 0.0001, ns = not significant. Symbols represent death events (a), mean ± SEM (b), or individual viral loads (d–j), and lines represent mean values (d–j). Data were pooled from at least three independent experiments. FFU Eq = focus-forming unit equivalents; L.O.D. = limit of detection.
Fig. 2
Fig. 2
Mortality, weight loss, morbidity, and viral loads for μMT mice after OROV infection. (a) Survival and (b) weight of C57BL/6 WT mice (grey, n = 14), μMT mice (orange, n = 18), and TCRβδ mice (green, n = 21) over 21 days post-infection (dpi) with 105 FFU of OROV. Statistical differences were assessed using a log-rank test with Bonferroni correction (a). ∗∗∗∗p < 0.0001. (c) Clinical scores for μMT mice (n = 18) after OROV infection. Bars indicate the percent occurrence for each clinical score among all mice. Clinical scores were defined as in Fig. 1. (d–j) Viral loads in serum and tissues from infected μMT mice (n = 10 at each time point) measured via focus-forming assay. Statistical differences were assessed using the Kruskal–Wallis test with Dunn’s post-hoc test across all days post-infection. ∗p < 0.05, ∗∗p < 0.01, ∗∗∗p < 0.001, ∗∗∗∗p < 0.0001, ns = not significant. Symbols represent death events (a), mean ± SEM (b), or individual viral loads (d–j), and lines represent mean values (d–j). Data were pooled from at least three independent experiments. L.O.D. = limit of detection.
Fig. 3
Fig. 3
Mortality, weight loss, morbidity, and viral loads for CD19-Cre+MyD88fl mice after OROV infection. (a) Survival and (b) weight of CD19-Cre+MyD88fl/fl mice (blue circles, n = 19), CD19-Cre+MyD88fl/wt mice (blue triangles, n = 11), and CreMyD88fl/fl or CD19-Cre+MyD88wt/wt mice (grey circles, n = 17) over 21 days post-infection (dpi) with 105 FFU of OROV. Statistical differences were assessed using a log-rank test with Bonferroni correction (a). ∗p < 0.05. (c, d) Clinical scores for WT mice (n = 19) and CD19-Cre+MyD88fl mice (n = 19) after OROV infection. Bars indicate the percent occurrence for each clinical score among all mice. Clinical scores were defined as in Fig. 1. (e–k) Viral loads in serum and tissues from infected CD19-Cre+MyD88fl mice (blue, n = 12 at each time point) and CreMyD88fl/fl or CD19-Cre+MyD88wt/wt mice (grey, n = 12 at each time point) measured via focus-forming assay. Statistical differences were assessed using the Kruskal–Wallis test with Dunn’s post-hoc test for each group versus day 1 post-infection. ns = not significant. Symbols represent death events (a), mean ± SEM (b), or individual viral loads (e–k), and lines represent mean values (e–k). Data were pooled from at least three independent experiments. L.O.D. = limit of detection.
Fig. 4
Fig. 4
Mortality, weight loss, and viral loads for Rag1−/− mice and IgM responses after OROV infection. (a) Survival and (b) weight of Rag1−/− mice inoculated on the day of OROV challenge with sera harvested from WT mice 3–6 days post-infection (dpi) (coloured numbers, n = 6 per group). (c) Viral loads in serum and tissues from mice in (a, b) measured via focus-forming assay (coloured numbers, n = 6 per group). (d) Survival and (e) weight of Rag1−/− mice inoculated on the day of mock manipulation (orange, n = 5) or OROV challenge (red, n = 7) with β-ME-treated sera harvested from WT mice on day 6 post-infection. (f) Viral loads in serum and tissues from mice in (d, e) measured via focus-forming assay (n = 5 for mock manipulation, n = 7 for OROV challenge). Statistical differences were assessed using a log-rank test with Bonferroni correction (a, d) or the Kruskal–Wallis test with Dunn’s post-hoc test across all tissue samples (c, f). ∗∗∗p < 0.001, ∗∗∗∗p < 0.0001, ns = not significant. Symbols represent death events (a, d), mean ± SEM (b, e), or individual viral loads (c, f), and lines represent mean values (c, f). Data were pooled from at least three independent experiments. (g) Anti-OROV ELISA and (h) FRNT analyses of sera harvested from WT mice on days 6 or 14 post-infection before (grey, n = 10) and after treatment with β-ME (red, n = 5). (i) FRNT50 values for individual mice in (g, h) (n = 10 per group). Statistical differences were assessed using the Mann–Whitney test with Bonferroni correction (g, i). ∗p < 0.05, ∗∗∗∗p < 0.0001, ns = not significant. Symbols represent individual mice (g, i) or mean ± SEM (h), bars represent mean ± SEM (g, i), and lines represent three-parameter log-logistic regression curves for relative infection per dilution (h). Data were pooled from at least three independent experiments. L.O.D. = limit of detection.
Fig. 5
Fig. 5
Antibody responses in mice with MyD88-deficient B cells during OROV infection. (a, b) Quantification and (c, d) avidity of OROV-specific IgM (a, c) and IgG isotypes (b, d) in serum samples (10-fold dilution) from WT mice (grey, n = 8 per condition/time point) and CD19-Cre+MyD88fl mice (blue, n = 8 per condition/time point) after mock manipulation (NI = noninfected) or at the indicated days post-infection (dpi) with 105 FFU of OROV. (e) Neutralisation potency index (log FRNT50/Ig) of serum samples from WT mice and CD19-Cre+MyD88fl mice (n = 8 for 6 dpi and n = 10 for 14 dpi). Statistical differences were assessed using the Mann–Whitney test with Bonferroni correction (a–e). ∗p < 0.05, ∗∗p < 0.01, ∗∗∗p < 0.001, ∗∗∗∗p < 0.0001, ns = not significant. Symbols represent individual mice, and bars represent mean ± SEM (a–e). (f–h) FRNT analysis of sera harvested from (f) WT mice (grey, n = 6 for NI, n = 6 for 6 dpi, and n = 16 for 14 dpi) and (g) CD19-Cre+MyD88fl mice (blue, n = 3 for NI, n = 8 for 6 dpi, and n = 8 for 14 dpi) after mock manipulation or at the indicated days post-infection, with (h) FRNT50 values for individual WT mice (grey, n = 5 for NI, n = 6 for 6 dpi, and n = 16 for 14 dpi) and CD19-Cre+MyD88fl mice (blue, n = 3 for NI, n = 7 for 6 dpi, and n = 7 for 14 dpi). Ascitic fluid (anti-OROV) was used as a positive control (purple). Statistical differences were assessed using the Mann–Whitney test with Bonferroni correction (h–i). ∗∗p < 0.01, ns = not significant. Symbols represent mean ± SEM (f, g) or individual mice (h), lines represent three-parameter log-logistic regression curves for relative infection per dilution (f, g), and bars represent mean ± SEM (h). (i) FRNT50 values for individual CD19-Cre+MyD88fl mice that survived (blue, n = 3) or succumbed to the infection (red, n = 2). Statistical differences were assessed using the Mann–Whitney test with Bonferroni correction (i). ns = not significant. Symbols represent individual mice, and lines represent mean values (i). nc = noncollected sample. (j) Survival and (k) weight of Rag1−/− mice inoculated on the day of OROV challenge with sera harvested from CD19-Cre+MyD88fl mice on day 6 (circles, n = 9) or day 14 post-infection (squares, n = 7). (l) Viral loads in serum and tissues from mice in (j, k) measured via focus-forming assay (n = 5 per group). Statistical differences were assessed using a log-rank test with Bonferroni correction (j) or the Kruskal–Wallis test with Dunn’s post-hoc test across all tissue samples (l). ns = not significant. Symbols represent death events (j), mean ± SEM (k), or individual viral loads (l), and lines represent mean values (l). L.O.D. = limit of detection.
Fig. 6
Fig. 6
B cell subset development and maintenance in MyD88-deficient mice during OROV infection. (a) Uniform Manifold Approximation and Projection (UMAP) representation of splenic CD3 Gr1 F4/80 lymphocytes from WT mice (grey, n = 8 per condition/time point) and CD19-Cre+MyD88fl mice (blue, n = 3 for noninfected [NI] and n = 8 at each time point) after mock manipulation or at days 6 or 14 post-infection (dpi) with 105 FFU of OROV. (b) B cell subset frequencies among splenic CD3 Gr1 F4/80 lymphocytes from (a). (c–m) B cell numbers per spleen for the indicated subsets from WT mice (grey, n = 8 per condition/time point) and CD19-Cre+MyD88fl mice (blue, n = 3 for NI and n = 8 at each time point) after mock manipulation or at days 6 or 14 post-infection with 105 FFU of OROV. B cell subsets were evaluated via flow cytometry as (c) B220, (d) B220int, (e) B220hi, (f) B220 CD138+ (plasma cells), (g) B220hi CD23 (marginal zone B cells), (h) B220hi CD23+ (follicular B cells), (i) B220hi CD138 GL7+ CD38 (germinal centre B cells), (j) B220hi CD138 GL7 CD38+ (memory B cells), (k) B220hi CD138int CD38+ (plasmablasts 1), and (l) B220int CD138+ (plasmablasts 2), alongside total cellularity (m). Statistical differences were assessed using the Mann–Whitney test with Bonferroni correction. ∗p < 0.05, ∗∗p < 0.01, ns = not significant. Symbols represent individual mice, and bars represent mean ± SEM. Red symbols indicate samples harvested from mice with clinical scores of 2 (at 6 dpi) or 3 (at 14 dpi).
Fig. 7
Fig. 7
The role of marginal zone B cells during OROV infection. Factor analysis of mixed data (FAMD) using mouse genotypes, IgM and IgG quantity, avidity, and neutralisation potency (indices and FRNT50 values), viral loads in brains, death events, and the cellularity of B cell subsets. (a) FAMD factor map showing the categorical variable of genotype for WT mice (n = 8 for noninfected [NI], n = 8 for 6 dpi, and n = 10 for 14 dpi) and CD19-Cre+MyD88fl mice (n = 7 for NI, n = 11 for 6 dpi, and n = 10 for 14 dpi). Colour-coded circles represent individual mice, white circles represent group centroids, and crossed circles represent the categorical variables of live (middle) and death events (top). (b) Quantitative variables are represented by arrows coloured to indicate relative contribution in each case (key) for WT mice (n = 8 for NI, n = 8 for 6 dpi, and n = 10 for 14 dpi) and CD19-Cre+MyD88fl mice (n = 7 for NI, n = 11 for 6 dpi, and n = 10 for 14 dpi). (c, d) The percent contribution of each variable to (c) Dim-1 and (d) Dim-2 for WT mice (n = 8 for NI, n = 8 for 6 dpi, and n = 10 for 14 dpi) and CD19-Cre+MyD88fl mice (n = 7 for NI, n = 11 for 6 dpi, and n = 10 for 14 dpi). The red line indicates the expected average value for a uniform contribution. (e) Correlation matrix colour-coded for percent contribution and variables for each dimension for WT mice (n = 8 for NI, n = 8 for 6 dpi, and n = 10 for 14 dpi) and CD19-Cre+MyD88fl mice (n = 7 for NI, n = 11 for 6 dpi, and n = 10 for 14 dpi). Data were pooled from at least three independent experiments. Plasmablasts 1 = B220hi CD138int CD38+ cells, plasmablasts 2 = B220int CD138+ cells. (f) Survival of Rag1−/− mice (red circles, n = 6) and CD19-Cre+MyD88fl mice (light grey squares, n = 6) after adoptive transfer of WT MZB cells or Rag1−/− mice (blue circles, n = 5) and CD19-Cre+MyD88fl mice (dark grey circles, n = 5) after adoptive transfer of CD19-Cre+MyD88fl MZB cells over 21 days post-infection (dpi) with 105 FFU of OROV. Statistical differences were assessed using a log-rank test with Bonferroni correction (f). ∗∗p < 0.01, ns = not significant (f). Symbols represent death events (f). (g) FRNT analysis of sera from CD19-Cre+MyD88fl mice at terminal harvest after adoptive transfer of WT MZB cells (light grey, n = 6) or CD19-Cre+MyD88fl MZB cells (dark grey, n = 5) during OROV infection as in (f). Symbols represent mean ± SEM, and lines represent three-parameter log-logistic regression curves for relative infection per dilution (g). (h) FRNT50 values for individual mice in (g) after adoptive transfer of WT MZB cells (light grey, n = 6) or CD19-Cre+MyD88fl MZB cells (dark grey, n = 5). Statistical differences were assessed using the Mann–Whitney test (h). ∗∗p < 0.01. Symbols represent individual mice, and bars represent mean ± SEM (h). MZB = marginal zone B.
Fig. 8
Fig. 8
Interpretation of the study. Early antibody responses produced mainly by MZB cells in a MyD88-dependent manner restrict viral replication and spread to the central nervous system, protecting mice from encephalitis and subsequent death after infection with OROV.
Supplemental Fig. S1

References

    1. Pinheiro F.D., Pinheiro M., Bensabath G., Causey O.R., Shope R.E. Epidemia de vírus Oropouche em Belém. Rev Ser Esp Saude Pub. 1962;12:15–23.
    1. Anderson C.R., Spence L., Downs W.G., Aitken T.H. Oropouche virus: a new human disease agent from Trinidad, West Indies. Am J Trop Med Hyg. 1961;10:574–578. doi: 10.4269/ajtmh.1961.10.574. - DOI - PubMed
    1. Romero-Alvarez D., Escobar L.E. Oropouche fever, an emergent disease from the Americas. Microbes Infect. 2018;20:135–146. doi: 10.1016/j.micinf.2017.11.013. - DOI - PubMed
    1. Baisley K.J., Watts D.M., Munstermann L.E., Wilson M.L. Epidemiology of endemic Oropouche virus transmission in upper Amazonian Peru. Am J Trop Med Hyg. 1998;59:710–716. doi: 10.4269/ajtmh.1998.59.710. - DOI - PubMed
    1. Ministério da Saúde Oropouche. https://www.gov.br/saude/pt-br/assuntos/saude-de-a-a-z/o/oropouche/paine...

MeSH terms

Substances

LinkOut - more resources