. 2025 Sep;24(9):e70140.
doi: 10.1111/acel.70140. Epub 2025 Jun 20.

Virus-Induced Cellular Senescence Causes Pulmonary Sequelae Post-Influenza Infection

Affiliations

Virus-Induced Cellular Senescence Causes Pulmonary Sequelae Post-Influenza Infection

Larissa Lipskaia et al. Aging Cell. 2025 Sep.

Abstract

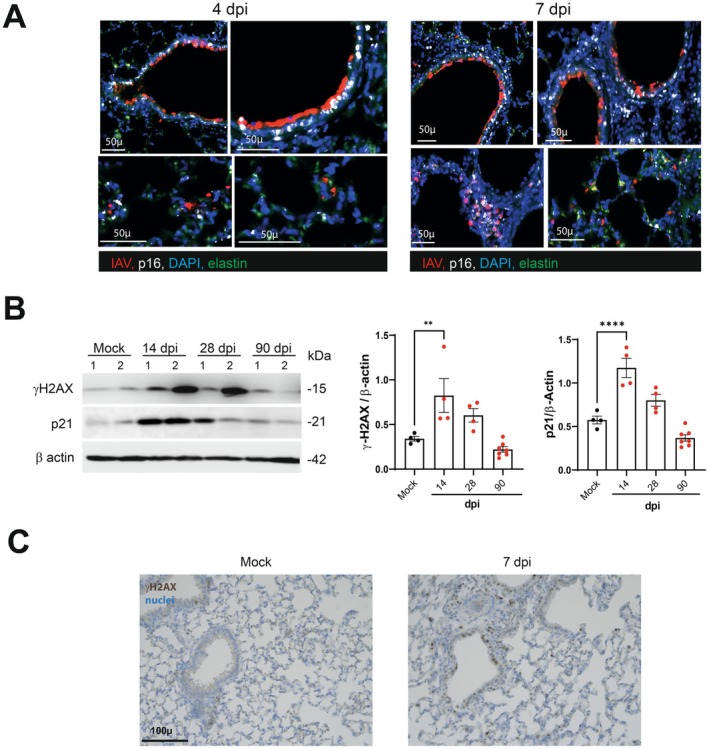
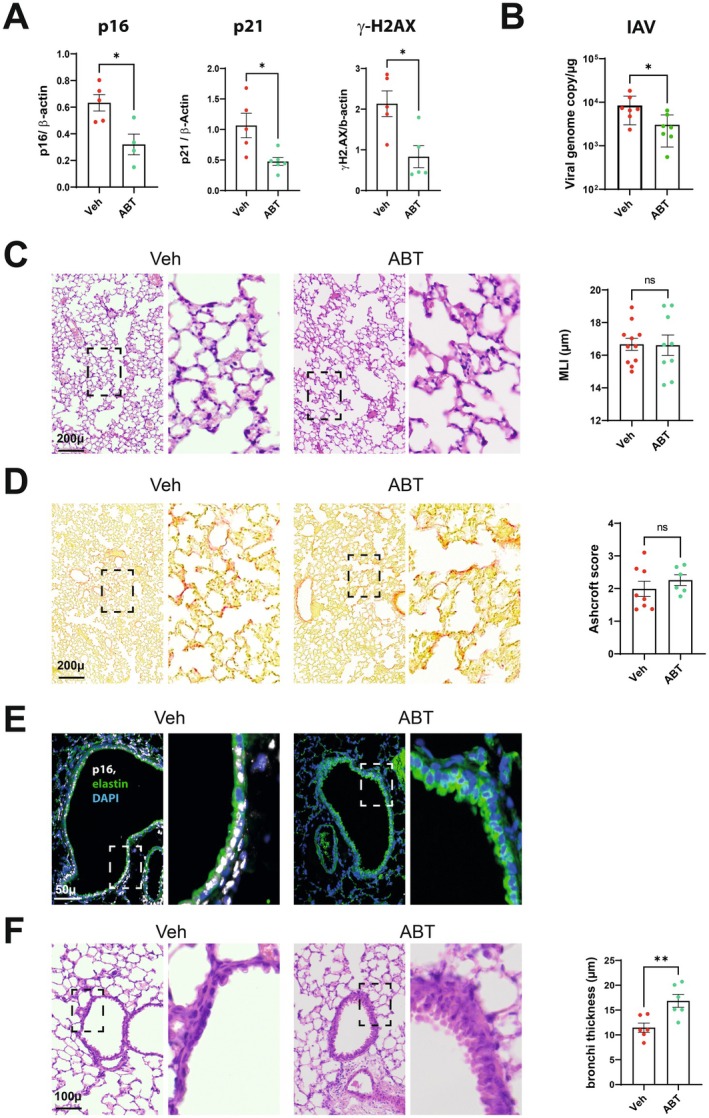
Influenza A virus (IAV) infection causes acute and long-term lung damage. Here, we used immunostaining, genetic, and pharmacological approaches to determine whether IAV-induced cellular senescence causes prolonged alterations in lungs. Mice infected with a sublethal dose of H1N1p2009 exhibited cellular senescence, as evidenced by increased pulmonary expression of p16, p21, β-galactosidase and the DNA damage marker gamma-H2A.X. Cellular senescence began 4 days post-infection (dpi) in the bronchial epithelium, then spread to the lung parenchyma by 7 and 28 dpi (long after viral clearance), and then declined by 90 dpi. At 28 dpi, the lungs showed severe remodeling with structural bronchial and alveolar lesions, abrasion of the airway epithelium, and pulmonary emphysema and fibrotic lesions that persisted up to 90 dpi. In mice and nonhuman primates, persistence of senescent cells in the bronchial wall on 28 dpi was associated with abrasion of the airway epithelium. In p16-ATTAC mice, depletion of p16-expressing cells with AP20187 reduced pulmonary emphysema and fibrosis and led to complete recovery of the airway epithelium at 28 dpi, indicating a marked acceleration of the epithelial repair process. Treatment with the senolytic drug ABT-263 also accelerated epithelial repair without affecting pulmonary fibrosis or emphysema. These positive effects occurred independently of viral clearance and lung inflammation at 7 dpi. Finally, AP20187 treatment of p16-ATTAC mice at 15 dpi led to complete recovery of the airway epithelium at 28 dpi. Thus, virus-induced senescent cells contribute to the pulmonary sequelae of influenza; targeting senescent cells may represent a new preventive therapeutic option.

Keywords: acute response; cellular senescence; chronic damage; epithelial damage; fibrosis; genetic approach; influenza; senolysis.


Conflict of interest statement

The authors declare no conflicts of interest.

Figures

FIGURE 1
FIGURE 1
Time course of pulmonary pathological manifestations and p16 and p21 expression following IAV infection. (A) Left panels. Representative micrographs of H&E‐stained lung sections showing bronchi (upper panel) and bronchial wall (lower panel) of mock‐infected mice and IAV‐infected mice. The zoomed areas are indicated by rectangles. Right panel. Scatter‐plot graph showing bronchial wall thickness. (B) Left panels, Representative micrographs showing lung parenchyma. Right panel. Scatter plot showing mean liner intercept (MLI) measurements. (C) Left panels, Representative micrographs showing lung parenchyma stained with Sirius Red used to visualize collagen deposition (hallmark of lung fibrosis). Zoomed area are indicated by squares. Right panel, Scatter‐plot graph showing parenchymal fibrosis quantification according to Aschcroft score. (D) Left panel. Representative micrographs showing immunofluorescence of p16 (white) in lung cells. Blue—DAPI nuclear staining, green—elastin autofluorescence. The zoomed areas (lower panels) are indicated. (E) Left panel. Representative micrographs showing p21 expression by immunohistochemistry. (D, E) Right panel, Scatter‐plot graphs representing the percentage of p16‐positive (D) and p21‐positive (E) cells in the different groups of mice. (A–E) Scales are indicated (bar = 50 or 100 μm). Graphs represent individual values per mice and the mean ± SEM (n = 3–11). Significant differences were determined using a one‐way ANOVA followed by Bonferroni post hoc test (*p < 0.05, **p < 0.01, ***p < 0.001, ****p < 0.0001).
FIGURE 2
FIGURE 2
p16 and viral antigen and ©H2AX and p21 co‐expression in lungs during influenza. (A) Representative micrograph showing immunofluorescence of viral hemagglutinin (IAV, red) and p16 (white) in lung sections collected from IAV‐infected mice at 4 and 7 dpi. Bleu—DAPI nuclear staining, green, elastin autofluorescence). Scales are indicated. (B) Expression of gamma‐H2A.X and p21 protein in IAV‐infected whole lung homogenates as assessed by western blotting. The relative protein levels are normalized to β Actin. Graphs represent individual values per mice and the mean ± SD (n = 4–7). Significant differences were determined using a one‐way ANOVA followed by Bonferroni post hoc test (**p < 0.01, ****p < 0.0001). (C) Expression of gammaH2AX in the lungs from mock‐infected and IAV‐infected (7 dpi) mice by immunohistochemistry. Blue–Nuclear hematoxylin staining (bar = 100 μm).
FIGURE 3
FIGURE 3
Identification of pulmonary cell types becoming senescent on 14 and 90 dpi. Representative micrographs showing immunofluorescence of p16 (white) in pulmonary cells co‐stained with cell‐type specific markers. Blue–DAPI nuclear staining, green–elastin autofluorescence (14 dpi). (A) Representative micrographs showing immunofluorescence of p16 (white) in microvascular endothelial cells (CD31), alveolar type II cells (Muc1) and macrophages (CD68). (B) The percentage of p16‐positive cells in each cell population is depicted (n = 3). Significant differences were determined using the two‐tailed Mann–Whitney U test (*p < 0.05, **p < 0.01). Of note, the total number of macrophages and parenchymal Muc1 stained cells were increased at 14 dpi, contrasting with a decreased number of lung endothelial cells (black asterisk). (C, D) Images showing p16 expression in peribronchial areas. Lung cells co‐stained either with (C) Muc1 (red, a marker of bronchial epithelial cells) or with (D) CD68 (red, a marker of macrophages). The zoomed areas (lower panels) are indicated by rectangles. (E) Micrographs showing immunofluorescence of p16 (white) in peribronchial area associated with the zone of defective epithelial layer (arrow, right images). Left image show normal bronchi on 90 dpi.
FIGURE 4
FIGURE 4
Consequences of genetic elimination of senescent cells on lung sequelae post‐influenza. p16‐ATTAC mice were intraperitoneally inoculated with AP20187 (0.5 mg/kg, twice weekly) starting the day before infection. Lungs from vehicle‐treated and AP20187‐treated mice were collected on 28 dpi. (A) Representative micrographs showing immunofluorescence of p16 (white) and CD68 (red) in lung cells. Blue–DAPI nuclear staining, green–Elastin autofluorescence. Bar—100 or 25 μm. (B) Effect of AP20187 treatment on macrophages infiltration in lung. Left panel, Representative whole lung scan showing CD68‐immunofluorescence (red). Blue–Dapi nucler staining. Right panel: Scatter plot showing the abundance of CD68 positive cells (% from total). Graphs represent individual values per mice and the mean ± SEM (n = 6–8). (C) Expression of p16, p21 protein and gammaH2AX in IAV‐infected whole lung homogenates as assessed by western blotting. The relative protein levels are normalized to β‐Actin (n = 5–8). (D) Effect of AP20187 treatment on lung emphysema. Left panel: Representative hematoxylin/eosin sections of lung from different group of mice. Bar = 200 μ. Right panel. Scatter plot showing mean liner intercept (MLI). (E) Effect of AP treatment on bronchial regeneration. Left panel: Representative micrographs showing bronchial wall. Hematoxylin/eosin staining. Bar 25 μ. Right panel. Scatter‐plot graph showing bronchial wall thickness. (F) Effect of AP20187 treatment on pulmonary fibrosis. Left panel: Representative Sirus‐Red stained sections of lung from different group of mice. Bar = 200 μ. Right panel. Scatter plot showing Ashcroft score. (G) Relative expression of the pulmonary fibrosis markers Coll3 and pSmad3 in whole lung homogenates as assessed by western blotting. The protein level of Coll3 was normalized to beta Actin and thatt of pSmad3 was normalized to Smad3. (B–G) Graphs represent individual values per mice and the mean ± SEM (n = 7–8). One of two representative experiments is shown. Significant differences was determined using the Mann–Whitney U test (*p < 0.05, **p < 0.01, ***p < 0.001, ****p < 0.001).
FIGURE 5
FIGURE 5
Consequences of senescent cells removal on the acute phase response of influenza. Lungs from vehicle‐treated and AP20187‐treated mice were collected on 7 dpi. (A) Viral load (left panel) and the interferon‐stimulated genes Isg15, Oas3 and Ifnb were quantified by quantitative RT‐qPCR. (B, C) mRNA copy numbers (for inflammatory genes in panel B and for genes related to barrier functions in panel C) were quantified by RT‐qPCR. (A–C) The data are expressed as the mean ± SD fold change relative to average gene expression in mock‐infected animals. (D Left panel, Representative micrographs showing CD68‐labeled lungs from mock‐infected and IAV‐infected (vehicle and AP20187‐treated) p16‐ATTAC mice (magnification: ×2.5). Left panel, The percentage of CD68‐postive cells is indicated for each group. (E) Lungs were co‐labeled with anti‐CD68 and anti‐p16 antibodies. (A–D) Graphs represent individual values per mice and the mean ± SD (n = 6–8). One of two representative experiments is shown. Significant differences were determined using the two‐tailed Mann–Whitney U test (A–C) or using a one‐way ANOVA followed by Bonferroni post hoc test (D) (*p < 0.05, **p < 0.01, ****p < 0.0001).
FIGURE 6
FIGURE 6
Consequences of ABT‐263 treatment on lung sequelae post‐influenza. (A) Expression of p16, p21 protein and ‐H2AX in IAV‐infected whole lung homogenates as assessed by western blotting (28 dpi). The relative protein levels are normalized to beta‐Actin (n = 5–6). (B) Viral load as assessed by quantitative RT‐PCR (7 dpi). (C, D) Left panel. Lung sections (28 dpi) were stained with hematoxylin/eosin (C) or Sirius red (D) (bar = 200 μ). Right panel. Scatter plot showing mean liner intercept (MLI) and parenchymal fibrosis quantification. (E, F) Effect of senescent cells elimination on bronchial regeneration (bar = 100 μ) (28 dpi). (E) Representative micrographs showing immunofluorescence of p16 (white) in lung cells of vehicle‐treated and ABT‐263‐treated mice. Blue–DAPI nuclear staining. The zoomed areas are indicated by rectangles. Bar—100 μm. (F) Left panel, Representative micrographs of H&E‐stained lung sections. Right panel, Scatter‐plot graph showing bronchial wall thickness. (A–F) Graphs represent individual values per mice and the mean ± SD (n = 4–8). Significant differences was determined using the Mann–Whitney U test (*p < 0.05, **p < 0.01).
FIGURE 7
FIGURE 7
Consequences of senescent cells elimination during the early and recovery phases of influenza on lung sequelae post‐influenza. p16‐ATTAC mice were treated with AP20187 from 1 to 15 dpi (D1‐15) or from 15 to 28 dpi (D15‐28). Lungs from vehicle‐treated and AP20187‐treated mice were collected on 28 dpi. (A) Left panel, Effect of AP treatment on bronchial regeneration. Representative micrographs showing bronchial wall (hematoxylin/eosin staining, bar = 50 μ). (B) Left panel, Effect of AP treatment on pulmonary fibrosis. Representative Sirius‐Red stained sections of lung from different group of mice. Bar = 50 μ. (C) Left panel, Effect of AP20187 treatment on lung emphysema (hematoxylin/eosin staining, bar = 200 μ). (A–C) Graphs represent individual values per mice and the mean ± SEM (n = 4–9). Significant differences were determined using a one‐way ANOVA followed by Bonferroni post hoc test (*p < 0.05, **p < 0.01, ****p < 0.001).

References

    1. Aguado, J. , Amarilla A. A., Taherian Fard A., et al. 2023. “Senolytic Therapy Alleviates Physiological Human Brain Aging and COVID‐19 Neuropathology.” Nature Aging 3: 1561–1575. - PMC - PubMed
    1. Barnes, P. J. , Baker J., and Donnelly L. E.. 2019. “Cellular Senescence as a Mechanism and Target in Chronic Lung Diseases.” American Journal of Respiratory and Critical Care Medicine 200: 556–564. - PubMed
    1. Born, E. , Lipskaia L., Breau M., et al. 2023. “Eliminating Senescent Cells Can Promote Pulmonary Hypertension Development and Progression.” Circulation 147: 650–666. - PubMed
    1. Burd, C. E. , Sorrentino J. A., Clark K. S., et al. 2013. “Monitoring Tumorigenesis and Senescence In Vivo With a p16(INK4a)‐Luciferase Model.” Cell 152: 340–351. - PMC - PubMed
    1. Camell, C. D. , Yousefzadeh M. J., Zhu Y., et al. 2021. “Senolytics Reduce Coronavirus‐Related Mortality in Old Mice.” Science 373: eabe4832. - PMC - PubMed

LinkOut - more resources