. 2025 Jun 20;11(1):177.
doi: 10.1038/s41531-025-01048-2.

Dopamine and cortical neurons with different Parkinsonian mutations show variation in lysosomal and mitochondrial dysfunction

Affiliations

Dopamine and cortical neurons with different Parkinsonian mutations show variation in lysosomal and mitochondrial dysfunction

Jessica Chedid et al. NPJ Parkinsons Dis. .

Abstract

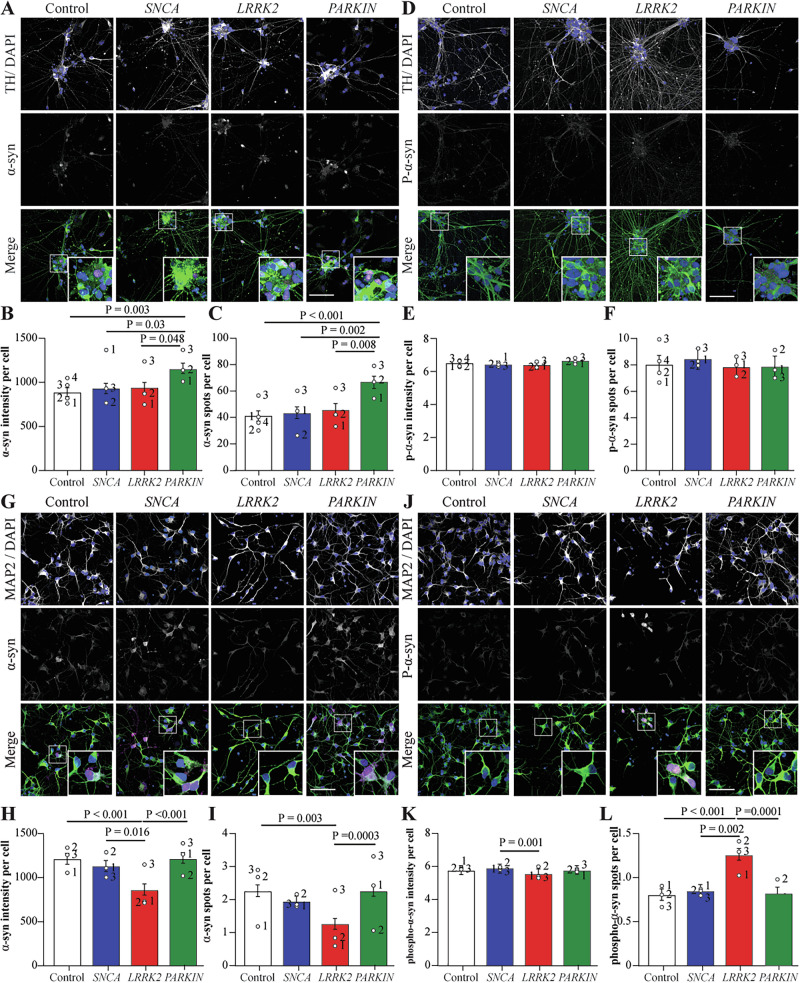
Mutations causing Parkinson's disease (PD) give diverse pathological phenotypes whose cellular correlates remain to be determined. Those with PRKN mutations have significantly earlier selective vulnerability of dopamine neurons, those with SNCA mutations have increased alpha-synuclein deposition, while those with LRRK2 mutations have additional deposition of tau. Yet all three mutation types are implicated in mitochondrial and/or lysosomal dysfunction. To compare cellular dysfunctions associated with these different pathological phenotypes, an unbiased high-content imaging platform was developed to assess both lysosomal and mitochondrial dysfunction, along with alpha-synuclein and tau protein deposition using induced pluripotent stem cell (iPSC) derived cortical and ventral midbrain neurons. Different PD mutations caused cell type specific dysfunctions, likely to impact on both selective neuronal vulnerability and the pathologies observed in PD. Comparison of dopamine neurons identified that both lysosomal and mitochondrial dysfunction were predominant with PRKN lof mutations, whereas SNCA A53T and LRRK2 R1441G mutations had increased tau deposition. In contrast, cortical neurons with SNCA and LRRK2 mutations both had mitochondrial and autophagy impairments without protein deposition, with LRRK2 cells additionally showing decreased glucocerebrosidase activity and increased alpha-synuclein phosphorylation.


Conflict of interest statement

Competing interests: The authors declare no competing interests.

Figures

Fig. 1
Fig. 1. Successful differentiation of ventral midbrain dopamine and cortical neurons with SNCA, LRRK2 and PRKN mutations.
A Representative images of VMDA neurons immunostained with FoxA2 (magenta), MAP2 (green) and DAPI (blue). B Percentage of VMDA neurons expressing FoxA2 in the different mutation groups. C Representative images of VMDA neurons immunostained with TH (yellow), MAP2 (green) and DAPI. D Percentage of VMDA neurons expressing TH in the different mutation groups. E Representative images of cortical neurons immunostained with TBR1 (orange), MAP2 (green) and DAPI (blue) and (F) subsequent quantification. G Representative images of cortical neurons immunostained with CTIP2, MAP2 (green) and DAPI (blue) and (H) subsequent quantification. I Representative images of cortical neurons immunostained with BRN2, MAP2 (green) and DAPI (blue) and (J) subsequent quantification. The scale bar in all images is 200 µm. Image quantification graphs show estimated marginal mean ± SEM. Each datapoint on the graph represents the mean value for each cell line derived from n = 2 biological replications (each performed in at least duplicate). K Representative Immunoblots and subsequent quantification of Parkin (L), total α-syn (M), Ser129 α-syn (N), Rab10 (O) and glucocerebrosidase (P) proteins respectively in cortical neurons of different mutation groups. Protein expression is normalised to β-actin. Graphs show mean ± SEM with data points derived from n = 2 independent experiments.
Fig. 2
Fig. 2. Glucocerebrosidase activity in VMDA and cortical neurons of the different mutation groups.
ARepresentative images of the PFB-FDGlu fluorescence (white) in VMDA neurons at 45 min after addition of the substrate, with Hoechst (blue). B GCase activity index calculated for each cell line of the different mutation groups in VMDA neurons. C Representative images of the DQ red BSA fluorescence (magenta) in VMDA neurons at 90 min after addition of the substrate with Hoechst (Blue). D Intensity of DQ red BSA fluorescence per cell calculated for each cell line of the different mutation groups in VMDA neurons. E Representative images of the PFB-FDGlu fluorescence (white) in the cortical neurons at 45 min after addition of the substrate, with Hoechst (blue). F GCase activity index calculated for each cell line of the different mutation groups in cortical neurons. G GCase activity index normalised with the protein expression level of GBA for each cell line of the different mutation groups. H Representative images of the DQ red BSA fluorescence (white) in cortical neurons at 90 min after addition of the substrate with Hoechst (Blue). I Intensity of DQ red BSA fluorescence per cell calculated for each cell line of the different mutation groups in cortical neurons. The scale bar in all images is 200 µm. Image quantification graphs show estimated marginal mean ± SEM. Each datapoint on the graph represents the mean value for each cell line derived from n = 3 biological replications (each performed in at least duplicate).
Fig. 3
Fig. 3. Autophagy markers in VMDA and cortical neurons show distinct phenotypes in PRKN and SNCA mutations.
A Representative images of VMDA neurons immunostained with P62 (Magenta), TH (green) and DAPI (blue) in the absence (left panel) and presence (right panel) of Bafilomycin A1. The number of P62 spots per cell in the different mutation groups of VMDA neurons in the absence (B) or presence (C) of Bafilomycin A1. D) Representative images of cortical neurons immunostained with P62 (Magenta), MAP2 (green) and DAPI (blue) in the absence (left panel) and presence (right panel) of Bafilomycin A1. The number of P62 spots per cell in the different mutation groups of cortical neurons in the absence (E) or presence (F) of Bafilomycin A1. Representative immunoblot (G) and subsequent quantification (H) of P62 protein levels in cortical neurons of different mutation groups. Protein expression is normalised to β-actin. I) Representative images of cortical neurons immunostained with Galectin-3 ((magenta), MAP2 (green) and DAPI (blue). J) Representative images of VMDA neurons immunostained with TFEB (magenta), TH (green) and DAPI (blue). The number (K) and size (L) of Galectin-3 spots in the different mutation groups of cortical neurons M) TFEB intensity per cell in the different mutauion groups of VMDA neurons. The scale bar in all images is 200 µm. Image quantification graphs show estimated marginal mean ± SEM. Each datapoint on the graph represents the mean value for each cell line derived from n = 3 biological replications (each performed in at least duplicate).
Fig. 4
Fig. 4. Mitochondrial respiration impairment in VMDA and cortical neurons with PRKN, LRRK2 and SNCA mutations.
Mitochondrial respiration was accessed by measuring extra cellular oxygen consumption rates of (A) dopamine neurons and (B) cortical neurons derived from control, PRKN, LRRK2, and SNCA mutation lines over a duration of 140 min. Graphs show mean ± SEM at each timepoint. The slopes of PD groups were compared with the Control using One-Way ANOVA test, and their statistical significance levels were marked in the graph. Each datapoint on the graph represents the average of the three cell lines per mutation group, derived each from n = 3 biological replicates.
Fig. 5
Fig. 5. Alpha-synuclein staining shows distinct pathology in PRKN mutation dopamine neurons.
A Representative images of VMDA neurons immunostained with total α-syn (magenta), TH (green) and DAPI (blue). B α-syn intensity per cell in the different mutation groups of VMDA neurons. C Number of α-syn spots per cell in the different mutation groups of cortical neurons. D Representative images of VMDA neurons immunostained with S129-phospho-α-syn (magenta), TH (green) and DAPI (blue). E P-α-syn intensity per cell in the different mutation groups of VMDA neurons. F number of p-α-syn spots per cell in the different mutation groups of VMDA neurons. G Representative images of cortical neurons immunostained with α-syn (magenta), MAP2 (green) and DAPI. H α-syn intensity per cell in the different mutation groups of cortical neurons. I Number of α-syn spots per cell in the different mutation groups of cortical neurons. J Representative images of cortical neurons immunostained with p-α-syn (magenta), MAP2 (green) and DAPI. K P-α-syn intensity per cell in the different mutation groups of cortical neurons. L Number of p-α-syn spots per cell in the different mutation groups of cortical neurons. The scale bar in all images is 200 µm. Image quantification graphs show estimated marginal mean ± SEM. Each datapoint on the graph represents the mean value for each cell line derived fromn = 3 biological replications (each performed in at least duplicate).
Fig. 6
Fig. 6. Tau staining shows distinct pathology in LRRK2 and SNCA mutation dopamine neurons.
A Representative images of VMDA neurons immunostained with total Tau (magenta), TH (green) and DAPI (blue). B Tau intensity per cell in the different mutation groups of VMDA neurons. C Number of Tau spots per cell in the different mutation groups of cortical neurons. D Representative images of VMDA neurons immunostained with p-Tau (magenta), TH (green) and DAPI (blue). E P-Tau intensity per cell in the different mutation groups of VMDA neurons. F number of p-Tau spots per cell in the different mutation groups of VMDA neurons. G Representative images of cortical neurons immunostained with total Tau (magenta), MAP2 (green) and DAPI. H Tau intensity per cell in the different mutation groups of cortical neurons. I Number of Tau spots per cell in the different mutation groups of cortical neurons. J Representative images of cortical neurons immunostained with P-Tau (magenta), MAP2 (green) and DAPI. K P-Tau intensity per cell in the different mutation groups of cortical neurons. The scale bar in all images is 200 µm. Image quantification graphs show estimated marginal mean ± SEM. Each datapoint on the graph represents the mean value for each cell line derived from n = 3 biological replications (each performed in at least duplicate).

References

    1. Kalia, L. V. & Lang, A. E. Parkinson’s disease. Lancet386, 896–912 (2015). - PubMed
    1. Halliday, G. et al. The progression of pathology in longitudinally followed patients with Parkinson’s disease. Acta Neuropathol.115, 409–415 (2008). - PubMed
    1. Schapira, A. H. V., Chaudhuri, K. R. & Jenner, P. Non-motor features of Parkinson disease. Nat. Rev. Neurosci.18, 435–450 (2017). - PubMed
    1. Walker, L. & Attems, J. Prevalence of Concomitant Pathologies in Parkinson’s Disease: Implications for Prognosis, Diagnosis, and Insights into Common Pathogenic Mechanisms. J. Parkinsons Dis.14, 35–52 (2024). - PMC - PubMed
    1. Lang, A. E. et al. Trial of Cinpanemab in Early Parkinson’s Disease. N. Engl. J. Med387, 408–420 (2022). - PubMed

LinkOut - more resources