. 2025 Jun 20;16(1):5355.
doi: 10.1038/s41467-025-60204-7.

Iron deficiency causes aspartate-sensitive dysfunction in CD8+ T cells

Affiliations

Iron deficiency causes aspartate-sensitive dysfunction in CD8+ T cells

Megan R Teh et al. Nat Commun. .

Abstract

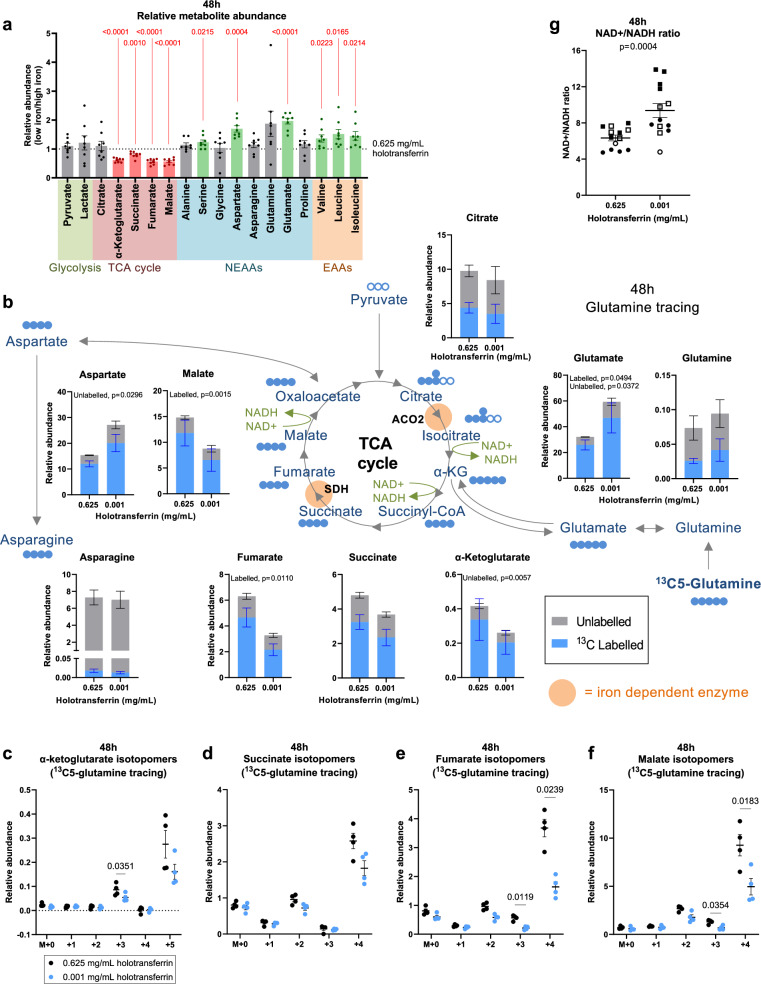
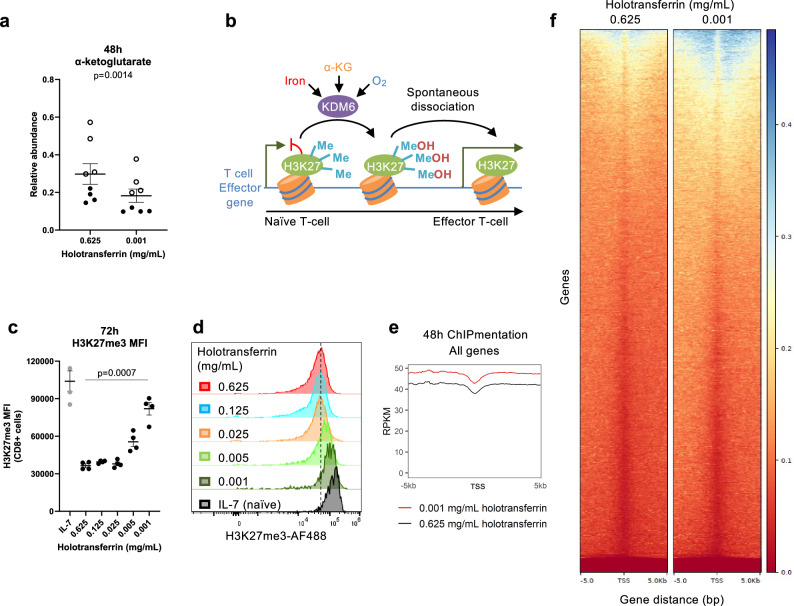
Iron is an irreplaceable co-factor for metabolism. Iron deficiency affects >1 billion people and decreased iron availability impairs immunity. Nevertheless, how iron deprivation impacts immune cell function remains poorly characterised. We interrogate how physiologically low iron availability affects CD8+ T cell metabolism and function, using multi-omic and metabolic labelling approaches. Iron limitation does not substantially alter initial post-activation increases in cell size and CD25 upregulation. However, low iron profoundly stalls proliferation (without influencing cell viability), alters histone methylation status, gene expression, and disrupts mitochondrial membrane potential. Glucose and glutamine metabolism in the TCA cycle is limited and partially reverses to a reductive trajectory. Previous studies identified mitochondria-derived aspartate as crucial for proliferation of transformed cells. Despite aberrant TCA cycling, aspartate is increased in stalled iron deficient CD8+ T cells but is not utilised for nucleotide synthesis, likely due to trapping within depolarised mitochondria. Exogenous aspartate markedly rescues expansion and some functions of severely iron-deficient CD8+ T cells. Overall, iron scarcity creates a mitochondrial-located metabolic bottleneck, which is bypassed by supplying inhibited biochemical processes with aspartate. These findings reveal molecular consequences of iron deficiency for CD8+ T cell function, providing mechanistic insight into the basis for immune impairment during iron deficiency.


Conflict of interest statement

Competing interests: T.A.M. is a paid consultant for and shareholder in Dark Blue Therapeutics Ltd. D.A.T. undertakes paid consultancy work for Sitryx Ltd. The remaining authors declare no competing interests.

Figures

Fig. 1
Fig. 1. Iron deficiency induces changes to metabolic processes at the RNA and protein levels.
a CD8+ OT-I T cells isolated from mice were activated with 5 µg/mL plate-bound α-CD3, 1 µg/mL α-CD28 and 50 U/mL IL-2 for 48 h in a titration of holotransferrin conditions. Naïve T cells were collected on day 0. Where comparisons between high and low iron conditions are made, the holotransferrin concentrations used are 0.625 (high) and 0.001 (low) mg/mL. b, c Division assessed using cell trace violet (CTV), n = 5. d CD25, e CD44, f TFR1/CD71, g CD98, h IL-2, i TNF and j IFN-γ mean fluorescence intensity (MFI), n = 4 except for (g) where n = 5. k Volcano plot with the significance thresholds of log2|fold change (FC)| > 0.585, p value < 0.05, n = 4. No correction for multiple testing was applied. l Correlation plot of the log2|FC| between high and low iron conditions by RNA-seq and protein-mass spectrometry (protein-MS), n = 4. m Hallmark gene set enrichment analysis (GSEA) for the protein-MS, n = 4. A Benjamini-Hochberg adjustment was used to correct for multiple testing. n p53 induces CDKN1A expression which inhibits the G1-S phase transition. Cdkn1a o mRNA and p protein expression and q percentage viable cells, n = 4. Data are mean ± standard error of the mean (SEM), where each datapoint per condition denotes cells from independent donor mice. Statistics are: (b, dj, oq) sampled matched one-way ANOVAs with the Geisser-Greenhouse correction; l two-sided Pearson correlation R2 value. Source data are provided as a Source Data file.
Fig. 2
Fig. 2. Iron deprivation induces changes to the mitochondrial proteome, mitochondrial reactive oxygen species (mROS) production and loss of mitochondrial membrane potential.
CD8+ T cells were activated as described in Fig. 1a. a mTORC1 and MYC are metabolic regulators that enable biosynthesis downstream of TCR stimulation. b, c mTORC1 activity measured via its downstream target, phospho-S6 (pS6), n = 4. Controls were treated overnight with rapamycin (rapa; 1 µM). d Heatmap of proteins in selected metabolic pathways defined using GO terms where the p value < 0.05, n = 4. Electron transport chain = GO_RESPIRATORY_ELECTRON_TRANSPORT_CHAIN, β-oxidation = GO_FATTY_ACID_BETA_OXIDATION, ribosome = GO_CYTOSOLIC_RIBOSOME, amino acid (AA) transport = GO_AMINO_ACID_IMPORT. e Mitochondrial membrane mass measured using Mitotracker green (MTG) MFI, n = 4. PCA of the protein-MS f given prior selection for proteins in the MitoCarta3.0 gene set and g of all proteins, n = 4. h, i mROS MFI measured using MitoSOX red, n = 4. j Mitochondrial membrane potential calculated as the ratio of Mitotracker deep red (MTDR) to Mitotracker green (MTG), n = 4. k SOD2 protein expression by protein-MS, n = 4. Data are mean ± SEM, where each datapoint per condition denotes cells from independent donor mice. Statistics are: b, h, k matched one-way ANOVAs with the Geisser-Greenhouse correction; e, j matched two-tailed t-test. Source data are provided as a Source Data file.
Fig. 3
Fig. 3. Iron scarcity impairs tricarboxylic acid (TCA) cycle activity at the iron-dependent enzymes ACO2 and SDH.
CD8+ T cells were activated as described in Fig. 1a. For tracing experiments, T cells were activated in standard media for 24 h and then incubated in media containing 13C6-glucose or 13C5-glutamine for a further 24 h. a Relative metabolite abundance from T cells cultured in low iron (0.001 mg/mL holotransferrin) versus high iron (0.625 mg/mL holotransferrin), normalised to spiked in glutaric acid. Pooled relative total abundances from the 13C6-glucose and 13C5-glutamine experiments, n = 8. NEAA non-essential amino acids, EAA essential amino acids. P values are shown in red. b13C5-glutamine tracing, n = 4. Relative abundance of labelled and unlabelled metabolites calculated as the fraction labelled multiplied by the raw glutaric acid normalised abundance. Blue-filled circles indicate carbon atoms labelled from 13C5-glutamine. Empty circles indicate unlabelled carbon atoms. Relative abundance of c α-KG, d succinate, e fumarate and f malate mass isotopomers from 13C-glutamine tracing calculated as the fraction labelled multiplied by the raw glutaric acid normalised abundance, n = 4. g NAD+/NADH ratio. Data from independent experiments denoted by different symbols, n = 13. Data are mean ± SEM, where each datapoint per condition denotes cells from independent donor mice. Statistics are: a matched two-way ANOVA with the Geisser-Greenhouse correction and the Fisher’s least significant difference (LSD) test for multiple comparisons; bf matched two-way ANOVAs with the Geisser-Greenhouse correction and the Sidak correction for multiple comparisons; g matched two-tailed t-test. Source data are provided as a Source Data file.
Fig. 4
Fig. 4. Iron deficiency permits the accumulation of H3K27me3 in CD8+ T cells.
CD8+ T cells were activated as described in Fig. 1a. a Relative abundance of α-KG. Data from independent experiments denoted by different symbols, n = 8. b Lysine demethylase (KDM) enzymes use iron cofactors and α-KG and oxygen substrates to mediate the hydroxylation of methyl groups, which spontaneously dissociate to leave a demethylated histone. KDM6 enzymes remove the repressive histone mark, H3K27me3, from effector gene loci upon T cell activation. c, d H3K27me3 MFI. Naïve-like control cells were cultured in IL-7 (5 ng/mL), n = 4. e, f H3K27me3 enrichment at transcription start sites (TSSs) of all genes assessed by ChIPmentation, n = 3. RPKM reads per kilobase per million mapped reads, bp basepairs. Data are mean ± SEM, where each datapoint per condition denotes cells from independent donor mice. Histograms are normalised to the mode. Statistics are: a paired two-tailed t-test; c matched one-way ANOVA with the Geisser-Greenhouse correction. Source data are provided as a Source Data file.
Fig. 5
Fig. 5. Iron scarcity suppresses nucleotide synthesis downstream of aspartate incorporation.
CD8+ T cells were activated as described in Fig. 1a. For the 13C6-glucose tracing experiments, T cells were activated for 24 h and then incubated in media containing 13C6-glucose for a further 24 h. a Relative abundance of aspartate normalised to a glutaric acid spike in. Data from independent experiments denoted by different symbols, n = 8. b Aspartate is incorporated into purine and pyrimidine nucleotides. Relative abundance of c AICAR, n = 4. AICAR was normalised to spike in 15N-dT. d PPAT protein via protein-MS, n = 4. Relative abundance of e carbamoyl-aspartate and f orotate, n = 4. Carbamoyl-aspartate and orotate were normalised to be spiked in glutaric acid. g Schematic of 13C6-glucose tracing. Orange and green circles indicate 13C-labelled atoms. Orange circles show labelling expected from oxidative TCA cycling via PDH. Green circles indicate labelling from reductive TCA cycling via PC. PC activity measured via the h fractional labelling into heavy labelled metabolites expected from reductive TCA cycling and via i the ratio of (Malate M3−Succinate M3)/Pyruvate M3, n = 4. j PC protein expression via protein-MS, n = 4. k PCK2 protein expression via protein-MS, n = 4. l Division measured using cell trace violet (CTV) with or without pyruvate (10 mM), n = 4. Data are mean ± SEM, where each datapoint per condition denotes cells from independent donor mice. Statistics are: a, c, e, f, i paired two-tailed t-tests; d, j, k one-way ANOVAs with the Geisser-Greenhouse correction; h matched two-way ANOVA with the Sidak correction for multiple comparisons; l matched two-way ANOVA with the Geisser-Greenhouse correction. Source data are provided as a Source Data file.
Fig. 6
Fig. 6. Aspartate increases the carrying capacity of iron-deprived CD8+ T cell cultures.
CD8+ T cells were activated as described in Fig. 1a with or without aspartate (40 mM). a Aspartate is synthesised in the mitochondria but must be transported into the cytosol by the proton-dependent transporter, SLC25A12/13, for downstream metabolism. b Viable cell counts, n = 5. c Percentage of divided cells at 48 h and d percentage of cells undergoing 3+ divisions at 72 h assessed using cell trace violet (CTV), n = 5. e TFR1/CD71, f CD25 and g perforin MFI, n = 5. h IFN-γ MFI, n = 4. i mTORC1 activity measured via phospho-S6 (pS6), n = 4. j SAICAR and k N-carbamoyl-aspartate relative abundance normalised to spiked-in glutaric acid, n = 4. l H3K27me3 MFI, n = 4. Naïve-like control cells were cultured in IL-7 (5 ng/mL). Data are mean ± SEM, where each datapoint per condition denotes cells from independent donor mice. Statistics are: b non-linear regressions using exponential growth equations with an extra sum-of-squares F test applied for either high or low holotransferrin concentrations between aspartate-treated and untreated; ci, l two-way ANOVAs with the Geisser-Greenhouse correction; j, k one-way ANOVAs with the Geisser-Greenhouse correction. Source data are provided as a Source Data file.

References

    1. Ryan, D. G. et al. Coupling Krebs cycle metabolites to signalling in immunity and cancer. Nat. Metab.1, 16–33 (2019). - PMC - PubMed
    1. Finley, L. W. S. What is cancer metabolism?. Cell186, 1670–1688 (2023). - PMC - PubMed
    1. GBD 2021 Anaemia Collaborators. Prevalence, years lived with disability, and trends in anaemia burden by severity and cause, 1990-2021: findings from the Global Burden of Disease Study 2021. Lancet Haematol.10, e713–e734 (2023). - PMC - PubMed
    1. Pasricha, S. R., Tye-Din, J., Muckenthaler, M. U. & Swinkels, D. W. Iron deficiency. Lancet397, 233–248 (2021). - PubMed
    1. Frost, J. N. et al. Hepcidin-mediated hypoferremia disrupts immune responses to vaccination and infection. Med2, 164–179.e112 (2021). - PMC - PubMed

MeSH terms

LinkOut - more resources