. 2025 Jun 20;15(1):20139.
doi: 10.1038/s41598-025-04905-5.

Wavelength-dependent photodissociation of iodomethylbutane

Affiliations

Wavelength-dependent photodissociation of iodomethylbutane

Valerija Music et al. Sci Rep. .

Abstract

Ultrashort XUV pulses of the Free-Electron-LASer in Hamburg (FLASH) were used to investigate laser-induced fragmentation patterns of the prototypical chiral molecule 1-iodo-2-methyl-butane ([Formula: see text] [Formula: see text]I) in a pump-probe scheme. Ion velocity-map images and mass spectra of optical-laser-induced fragmentation were obtained for subsequent FEL exposure with photon energies of 63 eV and 75 eV. These energies specifically address the iodine 4d edge of neutral and singly charged iodine, respectively. The presented ion spectra for two optical pump-laser wavelengths, i.e., 800 nm and 267 nm, reveal substantially different cationic fragment yields in dependence on the wavelength and intensity. For the case of 800-nm-initiated fragmentation, the molecule dissociates notably slower than for the 267 nm pump. The results underscore the importance of considering optical-laser wavelength and intensity in the dissociation dynamics of this prototypical chiral molecule that is a promising candidate for future studies of its asymmetric nature.


Conflict of interest statement

Declarations. Competing interests: The authors declare no competing interests.

Figures

Fig. 1
Fig. 1
Schematic representation of the pump-probe experiment on 1-iodo-2-methyl-butane. The optical laser pulses photoexcite the molecule, either via one photon (4.6 eV, violet arrow) or multiphoton (1.6 eV, maroon arrows) absorption. Via the excited states, the molecule dissociates along the C–I bond involving either neutral or singly charged iodine which was subsequently probed via 4d photoionization using ultrashort XUV pulses. The potential energy curves displayed on the right were calculated via formula imageCASSCF for the ground state and the two excited states formula image formula image and formula image formula image resulting from the neutral dissociation along the C–I bond.
Fig. 2
Fig. 2
(a) Sketch of molecular dissociation for two different regimes. The temporal overlap of the OL and XUV pulses is defined as time zero (formula image). In green, the OL-late regime is displayed. Here, the molecule is first illuminated by XUV and then by OL pulses (0). Secondly in red, the OL-early regime is displayed. Here, OL-pump pulses initiate a photodissociation of the molecule and time-delayed XUV pulses probe the iodine at two exemplary times (1) and (2). (b) Sketch of the experimental set-up: The injection of the molecules is depicted via the blue line system starting at the middle right. The skeletal of the molecule with annotated carbon atoms is visualized on the lower right. In the VMI spectrometer indicated by the round plates, the molecules are intersected by an optical pump laser (red) and the time-delayed FEL (black). The created charged particles, cations and electrons, were guided in z-direction and imaged on position-sensitive detectors (laboratory frame orientation indicated on the lower left). The polarization of the optical laser is in the x–y plane for the optical laser and in the x–z plane for the circularly polarized XUV. The ToF readout provides information about the different arrival times and thus mass/charge spectra. In the scope of this work, solely the cation data is analyzed and presented.
Fig. 3
Fig. 3
Mass spectrum for one exemplary UV (267 nm) laser intensity of 5.2 formula image W/formula image. The most prominent peaks are labeled. The yield of the cations in arbitrary units, plotted on the y-axis and normalized to the peak m/z=27.
Fig. 4
Fig. 4
Mass spectrum for one exemplary NIR (800 nm) laser intensity 4.1 formula image W/formula image. Plotted are mass over charges against their yield in arbitrary units, normalized to the highest peak m/z=27. The iodine peak is partially overlapped by residual xenon, resulting from a calibration data set taken previously.
Fig. 5
Fig. 5
Yield of specific cationic fragments as a function of the UV laser intensity. Each value was normalized to the parent ion yield. Plotted are the mass over charges 27, 42, 63.5, 71 and 127. The lower intensity regime of the UV pulses, used for the below-presented UV-pump XUV-probe data, is shaded in light gray.
Fig. 6
Fig. 6
Yield of specific cationic fragments as a function of the NIR laser intensity. The yield is normalized to the yield of the parent cation with m/z=198. The higher intensity regime of the NIR pulses used, for the below-presented NIR-pump XUV-probe data, is shaded in light gray.
Fig. 7
Fig. 7
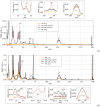
Mass spectra of 1-iodo-2-methyl-butane for different pump and probe schemes, (a) for the UV and (b) for the NIR pulses with an intensity of 0.4 formula image W/formula image and 4.3 formula image W/formula image, respectively. Compared are mass spectra resulting from the OL (orange), from the XUV-FEL ionization (gray), from OL-pump pulses 500 fs (UV)/2 ps (NIR) before the XUV-probe pulses (red, OL-early regime) and lastly from the probe pulses 500 fs (UV)/1 ps (NIR) before the pump pulses (black, OL-late regime). Enlarged views are plotted for (formula image), formula image, formula image, and formula image fragments. Short cation flight times are subject to ringing due to electronic feedback from the pulsing of the high voltage of the electron detector. Mass-to-charge ratios m/z=13 are therefore not analyzed. Xenon peaks result from residual gas of a previous calibration measurement. The FEL data was normalized by the GMD and the number of shots. A quantitative comparison between (a) and (b) cannot be provided by this data due to the different experimental conditions.
Fig. 8
Fig. 8
Radial distribution maps for the delay-dependent kinetic-energy distributions of formula image: (a) UV pump—XUV probe and (b) NIR pump—XUV probe. The projections of the radial distributions are displayed next to the maps: UV/NIR late in black for delays − 0.25/− 1 ps and UV/NIR early in red for delays +2/+5 ps. Three regions are marked, named 1, 2 and 3. The insets represent the integrated yield of the ion-energy channel formula image within the dashed-dotted white lines capturing region 2 as a function of pump-probe delay (red points) with a fit to a normal cumulative distribution function (black line). The central value of the fitted Gaussian function is indicated as formula image.
Fig. 9
Fig. 9
(a) Potential energy curves along the C–I bond for the ground state and the relevant formula image and formula image excited states. (b) Potential energy curves along the C–I bond for the energetically lowest states of the cation.

References

    1. Young, L. et al. Roadmap of ultrafast X-ray atomic and molecular physics. J. Phys. B At. Mol. Opt. Phys.51, 032003 (2018).
    1. McNeil, B. & Thompson, N. X-ray free-electron lasers. Nat. Photon.4, 814–821 (2010).
    1. Emma, P. et al. First lasing and operation of an ångstrom-wavelength free-electron laser. Nat. Photon.4, 641–647 (2010).
    1. Hartmann, G. et al. Attosecond time–energy structure of X-ray free-electron laser pulses. Nat. Photon.12, 215–220 (2018).
    1. Erk, B. et al. Imaging charge transfer in iodomethane upon X-ray photoabsorption. Science345, 288 (2014). - PubMed

LinkOut - more resources