. 2025 Jun 20;15(1):20132.
doi: 10.1038/s41598-025-04752-4.

Birth mode is associated with layer-specific mechanical changes in fetal membranes

Affiliations

Birth mode is associated with layer-specific mechanical changes in fetal membranes

Philip Friedrich et al. Sci Rep. .

Abstract

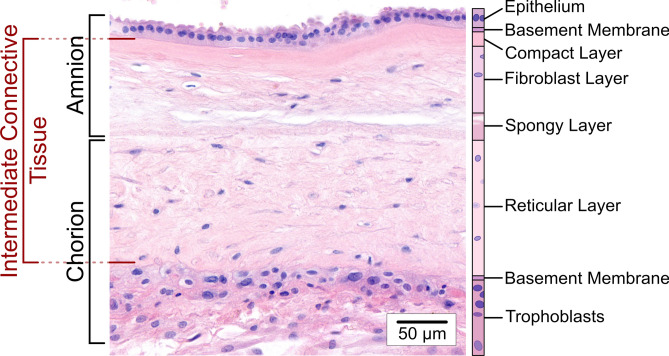
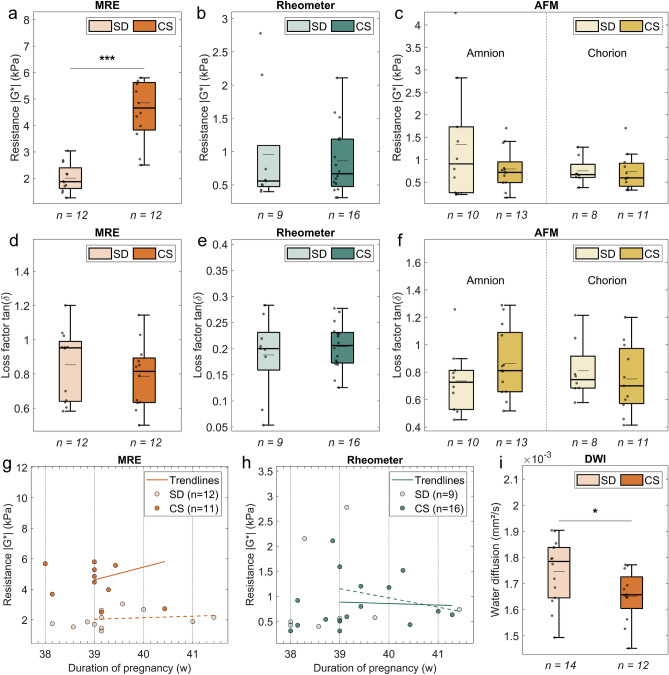
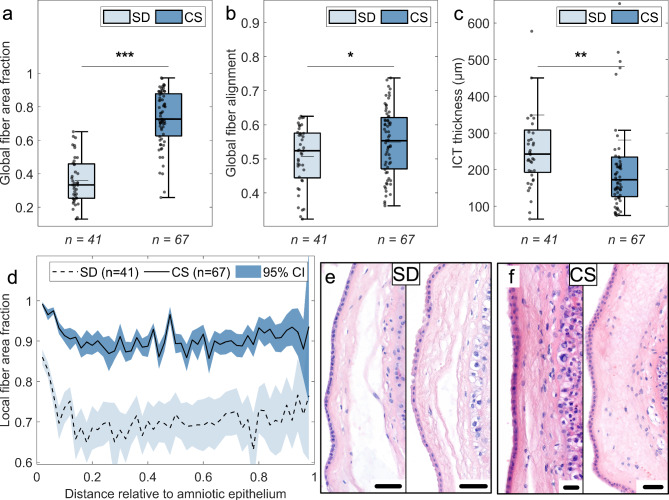
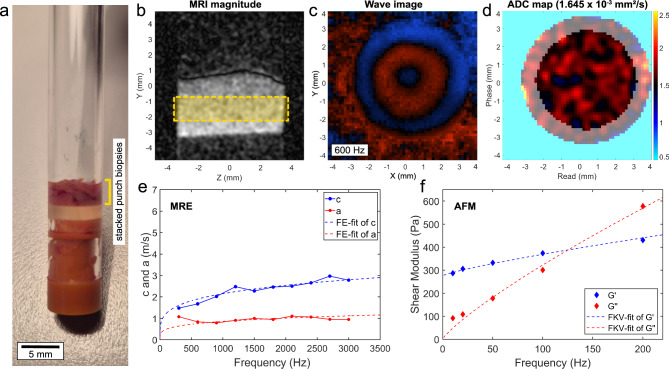
Rupture of fetal membranes and subsequent full-term birth are prerequisites for neonatal health, and a preterm rupture can lead to life-threatening complications. Our study determines the mechanical properties of term fetal membranes to identify perinatal structural changes by a unique biophysical multiscale approach, including atomic force microscopy, shear rheology, tabletop magnetic resonance elastography (MRE), and high-resolution optical microscopy. Fetal membranes from term spontaneous vaginal deliveries were compared to those from primary cesarean sections, used as a control group for pre-labor membranes. Spontaneously delivered term fetal membranes are softer and easier to deform in MRE experiments (median stiffness: 1.9 kPa, IQR 1.6-2.4) compared to controls (4.7 kPa, IQR 3.8-5.6); p < 0.001) and show increased water diffusion (median: 1.78 × 10⁻³ mm2/s, IQR: (1.65-1.84) × 10-3 vs. 1.66 × 10⁻³ mm2/s, IQR (1.60-1.73) × 10-3; p = 0.047). Their intermediate connective tissue layer (i.e. the collagen-rich area enclosed by the amnion and chorion) exhibits less ordered fiber alignment (median order parameter: 0.52, IQR 0.44-0.58 vs. 0.55, IQR 0.47-0.62; p = 0.04) and a looser fiber structure, as indicated by a significantly lower fiber area fraction (median: 0.33, IQR 0.25-0.46 vs. 0.73, IQR 0.63-0.88; p < 0.001) compared to the control membranes. These layer-specific changes in both structure and viscoelasticity are evidence for the dominant role of the intermediate connective tissue in maintaining membrane stability and the onset of rupture. Our mechanical and histopathological findings highlight the potential of mechanics-based screening-methods to assess the risk of preterm rupture and preterm birth to reduce neonatal morbidity.

Keywords: Atomic force microscopy; Fetal membranes; Magnetic resonance elastography; Rupture of membranes; Shear rheology; Tissue viscoelasticity.


Conflict of interest statement

Declarations. Competing interests: The authors declare no competing interests. Ethics approval and the use of human tissue samples: This study was approved by the local ethics committee (Approval No. 540/21-ek, Date: 2021-12-20). All experiments were performed in accordance with relevant guidelines and regulations. Human fetal membranes (FMs) were collected from pre-selected term pregnancies. All participants were provided informed consent during the study.

Figures

Fig. 1
Fig. 1
H&E-stained image section of the fetal membranes (FMs) obtained from a delivery via primary cesarean section showing the individual layers of amnion and chorion. The amniotic membrane consists of five sublayers: (1) a single-layered epithelium; (2) a thin basement membrane containing collagen types IV and VI along with glycoproteins; (3) a compact layer with densely packed collagen types I and III; (4) a fibroblast layer containing collagen types I and III, glycoproteins, fibroblasts, amniotic mesenchymal cells, and macrophages; and (5) a spongy layer rich in collagen type III. The spongy layer enables dynamic coupling between amnion and chorion and is also referred to as the intermediate layer,. The outer layer of the FMs is the chorion, which connects them to the uterine cavity and the decidua (gestationally modified endometrium). It consists of three sublayers: (1) a reticular layer containing fibrillar collagen types I, III, IV, V and VI and chorionic mesenchymal cells; (2) a basement membrane rich in collagen type IV and glycoproteins; and (3) a layer of chorionic trophoblast cells in contact with the trophoblast,. The two basement membranes of amnion and chorion surround several sublayers of collagen-rich extracellular matrix (ECM), which are here referred to as the intermediate connective tissue (ICT) of the FMs.
Fig. 2
Fig. 2
Mechanical properties and water diffusion of fetal membranes (FMs) collected from spontaneous vaginal deliveries (SD) and primary cesarean sections (CS). (af) Mechanical resistance (ac) and energy dissipation (df) measured by MRE (a,d), rheometer (b,e), and AFM (c,f). The mechanical resistance is calculated from multi-frequency measurements as the magnitude of the complex shear modulus (formula image), and the energy dissipation as the loss factor (see Eq. 5 in Materials and Methods—Tabletop Magnetic Resonance Elastography). The results are shown at suitable frequencies (MRE: 1 kHz, rheometer: 1 Hz, AFM: 100 Hz). Significant differences between delivery types were observed only in MRE measurements: SD FMs show lower mechanical resistance than CS FMs (a, 1.9 kPa (IQR 1.6–2.4) vs. 4.7 kPa (IQR 3.8–5.6), p < 0.001). No significant differences were observed for rheometer (p = 0.76) or AFM measurements (amnion: p = 0.44; chorion: p = 0.54). In addition, the median loss factor shows a slightly higher value for SD FMs in MRE experiments (d, 0.95 (IQR 0.64–0.99) vs. 0.82 (IQR 0.63–0.89), p = 0.37), but is non-significant in rheometer (p = 0.80) or AFM experiments (amnion: p = 0.20; chorion: p = 0.44). (gh) Scatter plots of mechanical resistance vs. pregnancy duration, measured by MRE (g) and rheometer (h), to assess stability trends as pregnancy reaches full term. Trendlines beginning at the end of the 39th week of pregnancy (i.e. at day 273) were added to the data, as this is the onset of decreasing tensile strength as reported by Pressman et al.. No clear correlation with pregnancy duration was observed for SD (empty markers, dashed line) or CS (filled markers, solid line) FMs (g, MRE: SD: R2 = 0.024, CS: R2 = 0.055; h, rheometer: SD: R2 = 0.038, CS: R2 = 0.003). (i) Water diffusion, assessed via MRI as the apparent diffusion coefficient, shows a significant tendency towards higher values in SD FMs compared to CS FMs (1.78 × 10−3 mm2/s (IQR 1.65–1.84 × 10−3) vs. 1.66 × 10−3 mm2/s (IQR 1.60–1.73 × 10−3), p = 0.047). In the boxplots, individual samples are shown as dots, median (mean) values are represented as thick (thin) horizontal lines (n = number of samples). Statistical significance was determined using a Wilcoxon rank-sum test: *p < 0.05, **p < 0.01, ***p < 0.001.
Fig. 3
Fig. 3
Analysis of the intermediate connective tissue (ICT) layer in histological images for fetal membranes (FMs) collected from spontaneous vaginal deliveries (SD) and primary cesarean sections (CS). (ac) Global fiber area fraction (a, measured as the ratio of fiber area to total ICT area), global fiber alignment (b, measured by the averaged two-dimensional local nematic order parameter which can indicate random (0) or parallel (1) fiber arrangement), and ICT thickness (c, measured using the averaged spatial correlation length) were calculated for each image section and compared in boxplots. SD FMs show a significantly reduced global fiber area fraction (a, 0.33 (0.25–0.46) vs. 0.73 (0.63–0.88), p < 0.001), a more random fiber alignment (b, 0.52 (0.44–0.58) vs. 0.55 (0.47–0.62), p = 0.04), and a greater ICT thickness (c, 242 µm (192–308) vs. 172 µm (126–234), p = 0.001) compared to CS FMs. Individual samples are shown as dots, median (mean) values are represented as thick (thin) horizontal lines (n = number of image sections). Statistical significance was determined using a Wilcoxon rank-sum test: *p < 0.05, **p < 0.01, ***p < 0.001. (d) Local fiber area fraction as a function of the distance from the amniotic epithelium, shown for SD (dashed line, light blue confidence interval) and CS (solid line, dark blue confidence interval) FMs. Local properties were calculated per pixel, compared to a local circular neighborhood with a 5 µm radius, and averaged per distance for each image section. Distance-dependent results from all image sections were then averaged and displayed with the 95% confidence interval. SD FMs show a smaller local fiber area fraction compared to CS FMs with a pronounced decrease near the amniotic epithelium. (ef) Representative histological image sections obtained from high resolution histological images of SD (e) and CS (f) FMs. The scale bars refer to a distance of 50 µm.
Fig. 4
Fig. 4
Overview of the mechanical testing and analysis of samples with MRE/MRI and AFM. (a) Image of a prepared sample for the tabletop magnetic resonance setup. Several punch biopsies were stacked on top of each other (see yellow marking) to increase the sample volume. (b) Vibration amplitude image of the sample in the glass tube. The yellow rectangle shows the typical area in which the signals were recorded. The slice was chosen with a thickness of 1.5 mm to exclude any surface effects. (c) Typical wave image recorded at a frequency of 600 Hz showing the propagation of the mechanical shear wave through the sample volume. The colors indicate a positive (red) or negative (blue) displacement along the z-axis. (d) Typical ADC map showing the average water diffusion for each pixel (averaged over the entire z range). The light grey area was excluded from further analysis as it often contained water inclusions located at the edge between the sample and the glass wall (indicated by the high diffusion coefficient, shown in yellow). (e) Shear wave speed formula image (blue) and shear wave penetration rate formula image (red), calculated from the wave images, shown for a representative example. Both properties were fitted using a fractional element model (dashed lines). (f) Shear storage (blue) and shear loss modulus (red) obtained from AFM measurements, shown for a representative example. The fractional Kelvin–Voigt model fits (dashed lines) show a crossover which was typically observed in the measured frequency range.

Similar articles

References

    1. Truong, N., Menon, R. & Richardson, L. The role of fetal membranes during gestation, at term, and preterm labor. Placenta Reprod. Med.2, 4 (2023). - PMC - PubMed
    1. Zhu, C. et al. Nutritional and physiological regulation of water transport in the conceptus. Adv. Exp. Med. Biol.1354, 109–125 (2022). - PubMed
    1. Moore, R. M., Mansour, J. M., Redline, R. W., Mercer, B. M. & Moore, J. J. The physiology of fetal membrane rupture: Insight gained from the determination of physical properties. Placenta27, 1037–1051 (2006). - PubMed
    1. Friel, N. A. et al. Amniotic fluid, cells, and membrane application. Oper. Tech. Sports Med.25, 20–24 (2017).
    1. Mercer, B. M. Preterm premature rupture of the membranes. Obstet. Gynecol.101, 178–193 (2003). - PubMed

LinkOut - more resources