. 2025 Jun 20;15(1):20187.
doi: 10.1038/s41598-025-06109-3.

Vitamin D and omega-3 fatty acids attenuate MSG-induced neurodegeneration by modulating tau pathology, neuroinflammation, and VDR expression in rats

Affiliations

Vitamin D and omega-3 fatty acids attenuate MSG-induced neurodegeneration by modulating tau pathology, neuroinflammation, and VDR expression in rats

Rasha Z Alshahawy et al. Sci Rep. .

Abstract

Monosodium glutamate (MSG)-induced excitotoxicity is a major factor contributing to cognitive decline and neurodegeneration. Given the well-established roles of vitamin D (Vit D) and omega-3 polyunsaturated fatty acids (N-3 PUFAs), especially eicosapentaenoic acid (EPA) and docosahexaenoic acid (DHA), in neuroprotection, the present study aimed at analyzing their possible neuroprotective efficacy against MSG-induced neurotoxicity in rats, concerning the behavioral performance, hippocampal histological integrity, and pathological protein accumulation, along with determination of the inflammatory marker levels and mRNA expression of vitamin D receptors (VDR) and other neurodegeneration-related genes. Fifty male Sprague Dawley rats were randomly allocated to a control, an MSG, and three treatment groups that received MSG and either Vit D or N-3 PUFA supplements in combinations or alone for 4 weeks. At the end of the study, five behavioral tests were conducted to assess cognitive functions, motor activity, and anxiety-related behaviors, and hippocampal tissues were analyzed for tau pathology, neuroinflammation, expression of VDR, and neurodegeneration-related markers. The results demonstrated that supplementation with Vit D (1 mcg/kg) and N-3 PUFAs (300 mg/kg EPA + DHA) profoundly attenuated MSG-induced neurodegeneration. The combined therapy decreased neuronal damage caused by MSG by 87% and tau pathology by 83%. The combined treatment further suppressed pro-inflammatory cytokines (TNF-α: 52%; IL-6: 65%) and elevated anti-inflammatory IL-10 by 2.8-fold, demonstrating a dual anti-inflammatory action. A major upregulation of hippocampal VDR by 4.6-fold was noted, with stabilization of calcium homeostasis and normalization of caspase-3 and α-synuclein expression. Our findings confirm that Vit D and N-3 PUFAs exhibit substantial synergistic neuroprotective abilities that might be mediated through synergistic VDR upregulation, providing a promising dietary intervention against MSG-induced excitotoxicity and highlighting their broader implications for supporting cognitive health and mitigating the adverse effects of other neurotoxins.

Keywords: MSG; Neuroinflammation; Omega-3 PUFAs; Tau pathology; VDRs; Vitamin D.


Conflict of interest statement

Declarations. Competing interests: The authors declare no competing interests. Ethics approval: The experimental protocol was approved by the Mansoura University Animal Care and Use Committee (MU-ACUC), Mansoura, Egypt, approval code: MU-ACUC (MED.PhD.23.06.2). All applicable international, national, and institutional ethical guidelines for the care and use of animals were followed. All procedures were performed under ARRIVE guidelines and followed the U.K. Animals ACT, of 1986. Consent for publication: All authors have read and approved the final manuscript for publication.

Figures

Fig. 1
Fig. 1
Rats’ performances in the open field test. The track plots show the positions of the animals during the entire duration of the test (A); the inner squares denote the supposed central zone. The graphs show the total distance traveled by the animals (B), average speed of animal movement (C), number of line crossings during the test period (D), number of grooming behaviors (E), number of rearing activities (F), number of entries into the central zone (G) and time spent in the central zone (H) among the experimental groups; the control group. MSG (Monosodium glutamate), Vit D (vitamin D), N-3 PUFAs (omega-3 polyunsaturated fatty acids) and the combined treatment group (MSG + Vit D + N-3). The data are expressed as the means ± SEMs or medians (IQRs) (n = 10 per group). Symbols above individual bars indicate a significant P value of < 0.05 for multiple pairwise comparisons between groups according to Tukey’s post hoc HSD test or Dunn’s multiple comparison test; (a): for significance vs. control; (b): for significance vs. MSG; (c): for significance vs. Vit D; and (d): for significance vs. N-3 PUFAs.
Fig. 2
Fig. 2
Rats’ exploratory performances in the novel object recognition test. The heatmaps represent the positions of the rats throughout the test duration; blue represents the shortest time, and red represents the longest time. The circle denotes the site of the novel object, whereas the rectangle represents the familiar object. The graph shows the exploratory preference behavior among the experimental groups: MSG (Monosodium glutamate), Vit D (vitamin D), N-3 PUFAs (omega-3 polyunsaturated fatty acids), and the combined treatment group (MSG + Vit D + N-3). Data are expressed as the median (IQR) (n = 10 per group). Symbols above individual bars indicate a significant P value of < 0.05 for multiple pairwise comparisons between groups according to Dunn’s multiple comparison test; (a): for significance vs. control; (b): for significance vs. MSG; (c): for significance vs. Vit D; and (d): for significance vs. N-3 PUFAs.
Fig. 3
Fig. 3
Spatial working memory performance in the T-maze. Graphs show the average choice latency across trials (A) and the percent of correct alternations among the experimental groups (B); the control group, MSG (Monosodium Glutamate), Vit D (vitamin D), N-3 PUFAs (omega-3 polyunsaturated fatty acids) and the combined treatment group (MSG + Vit D + N-3). Data are expressed as the median (IQR) (n = 10 per group). Symbols above individual bars indicate a significant P value of < 0.05 for multiple pairwise comparisons between groups according to Dunn’s multiple comparison test; (a): for significance vs. control; (b): for significance vs. MSG; (c): for significance vs. Vit D; and (d): for significance vs. N-3 PUFAs.
Fig. 4
Fig. 4
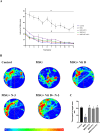
Learning performances and spatial working memory in the water maze. The learning curves of the escape latencies to reach the platform during the 12 training trials (A) and heatmap representation of the time spent by the animals in different parts of the apparatus during the probe test (B), with blue as the shortest time and red as the longest. The circles denote the supposed location of the removed platform in the target zone. The graph shows the average time spent in the target zone among the experimental groups during the probe test (C), the control group, MSG (Monosodium glutamate), Vit D (vitamin D), N-3 PUFAs (omega-3 polyunsaturated fatty acids), and the combined treatment group (MSG + Vit D + N-3). Data are expressed as the median (IQR) (n = 10 per group). Symbols above individual bars indicate a significant P value of < 0.05 for multiple pairwise comparisons between groups according to Dunn’s multiple comparison test; (a): for significance vs. control; (b): for significance vs. MSG; (c): for significance vs. Vit D; and (d): for significance vs. N-3 PUFAs.
Fig. 5
Fig. 5
Rats’ performances in the dark‒light box. The graphs show the latency to the 1st cross to the light side (A) and the percentage of time spent in the light chamber (B) among the experimental groups: the control group, MSG (monosodium glutamate), Vit D (vitamin D), N-3 PUFAs (omega-3 polyunsaturated fatty acids) and the combined treatment group (MSG + Vit D + N-3). Data are expressed as the median (IQR) (n = 10 per group). Data are expressed as the median (IQR). Symbols above individual bars indicate a significant P value of < 0.05 for multiple pairwise comparisons between groups according to Dunn’s multiple comparison test; (a): for significance vs. control; (b): for significance vs. MSG; (c): for significance vs. Vit D; and (d): for significance vs. N-3 PUFAs.
Fig. 6
Fig. 6
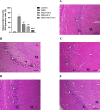
Histological findings in the hippocampal tissues of the experimental groups. The arrows indicate ischemic neuronal injury to the granular layer (the G and M letters indicate the granular and molecular layers, respectively), H&E, X200, scale bar = 50 μm. The bar graph represents the percentage of degenerated neurons/500 cells within the hippocampal granular layer among the experimental groups; (A) (the control group), (B) (monosodium glutamate group; MSG), (C) (vitamin D group; MSG + Vit D), (D) (omega-3 polyunsaturated fatty acid group; MSG + N-3), and (E) (the combined treatment group (MSG + Vit D + N-3)). The data are expressed as the means ± SEMs (n = 3 per group). Symbols above individual bars indicate a significant P value at < 0.05 for multiple pairwise comparisons between groups according to the Tukey HSD post hoc test; (a): for significance vs. control; (b): for significance vs. MSG; (c): for significance vs. Vit D; and (d): for significance vs. N-3 PUFAs.
Fig. 7
Fig. 7
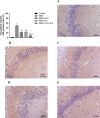
Tau immunostaining results in the hippocampi of the experimental groups. Arrowheads refer to tau-positive immunostained neurons within the granular cell layer of the hippocampus, Tau IHC, X200, bar = 50 μm; (A) (the control group), (B) (monosodium glutamate group; MSG), (C) (vitamin D group; MSG + Vit D), (D) (omega-3 polyunsaturated fatty acid group; MSG + N-3), and (E) (the combined treatment group (MSG + Vit D + N-3)). The data are expressed as the means ± SEMs (n = 5 per group). Symbols above individual bars indicate a significant P value of < 0.05 for multiple pairwise comparisons between groups according to the Tukey HSD post hoc test; (a): for significance vs. control; (b): for significance vs. MSG; (c): for significance vs. Vit D; and (d): for significance vs. N-3 PUFAs.
Fig. 8
Fig. 8
Hippocampal concentrations of inflammation-related cytokines. The graphs show the ELIZA results for the hippocampi of the rats in the following groups: (A): tumor necrosis factor-alpha (TNF-α), (B): interleukin-6 (IL-6), and (C) interleukin-10 (IL-10) in the brain hippocampi of the experimental groups; control, monosodium glutamate group; (MSG + vitamin D group; (MSG + Vit D), omega-3 polyunsaturated fatty acid group; (MSG + N-3), and the combined treatment group; (MSG + Vit D and N-3). The data are expressed as the means ± SEMs. Symbols above individual bars indicate a significant P value < 0.05 for multiple pairwise comparisons between groups by Tukey’s HSD post hoc test; (a): for significance vs. control; (b): for significance vs. MSG; (c): for significance vs. Vit D; and (d): for significance vs. N-3 PUFAs.
Fig. 9
Fig. 9
Representation of changes in rat hippocampus mRNA expression. The graphs show the fold changes in the expression of VDR (A), caspase-3 (B), α-synuclein (C), and calmodulin-1 (CaM-1) (D) in the brain hippocampi of the experimental groups relative to the control group. Monosodium glutamate group; (MSG), vitamin D group; (MSG + vitamin D), omega-3 polyunsaturated fatty acid group; (MSG + N-3), combined treatment group; (MSG + vitamin D and N-3). The data are expressed as the means ± SEMs (n = 10 per group). Symbols above individual bars indicate a significant P value of < 0.05 for multiple pairwise comparisons between groups according to the Tukey HSD post hoc test; (a): for significance vs. control; (b): for significance vs. MSG; (c): for significance vs. Vit D; and (d): for significance vs. N-3 PUFAs.

References

    1. Timoney, N. & Miller, B. Injury to the Developing Nervous System. In:The Encyclopedia of Child and Adolescent Development 1–11. https://doi.org/10.1002/9781119171492.wecad014 (2020).
    1. Grandjean, P. & Landrigan, P. J. Neurobehavioural effects of developmental toxicity. Lancet Neurol.13, 330–338. 10.1016/S1474-4422(13)70278-3 (2014). - PMC - PubMed
    1. Davidson, T. L. & Stevenson, R. J. Vulnerability of the Hippocampus to insults: links to Blood-Brain barrier dysfunction. Int. J. Mol. Sci.2510.3390/ijms25041991 (2024). - PMC - PubMed
    1. Appaiah, K. M. in In Ensuring Global Food Safety. (eds Christine, E., Boisrobert, A. & Stjepanovic) Academic, 217–226. (2010).
    1. Hajihasani, M. M., Soheili, V., Zirak, M. R., Sahebkar, A. & Shakeri, A. Natural products as safeguards against monosodium glutamate-induced toxicity. Iran. J. Basic. Med. Sci.23, 416–430. 10.22038/IJBMS.2020.43060.10123 (2020). - PMC - PubMed

MeSH terms