. 2025 Jun 20;15(1):20196.
doi: 10.1038/s41598-025-06220-5.

Exploring circulating cell-free DNA as a biomarker and as an inducer of AIM2-inflammasome-mediated inflammation in patients with abdominal aortic aneurysm

Affiliations

Exploring circulating cell-free DNA as a biomarker and as an inducer of AIM2-inflammasome-mediated inflammation in patients with abdominal aortic aneurysm

Susanne Dihlmann et al. Sci Rep. .

Abstract

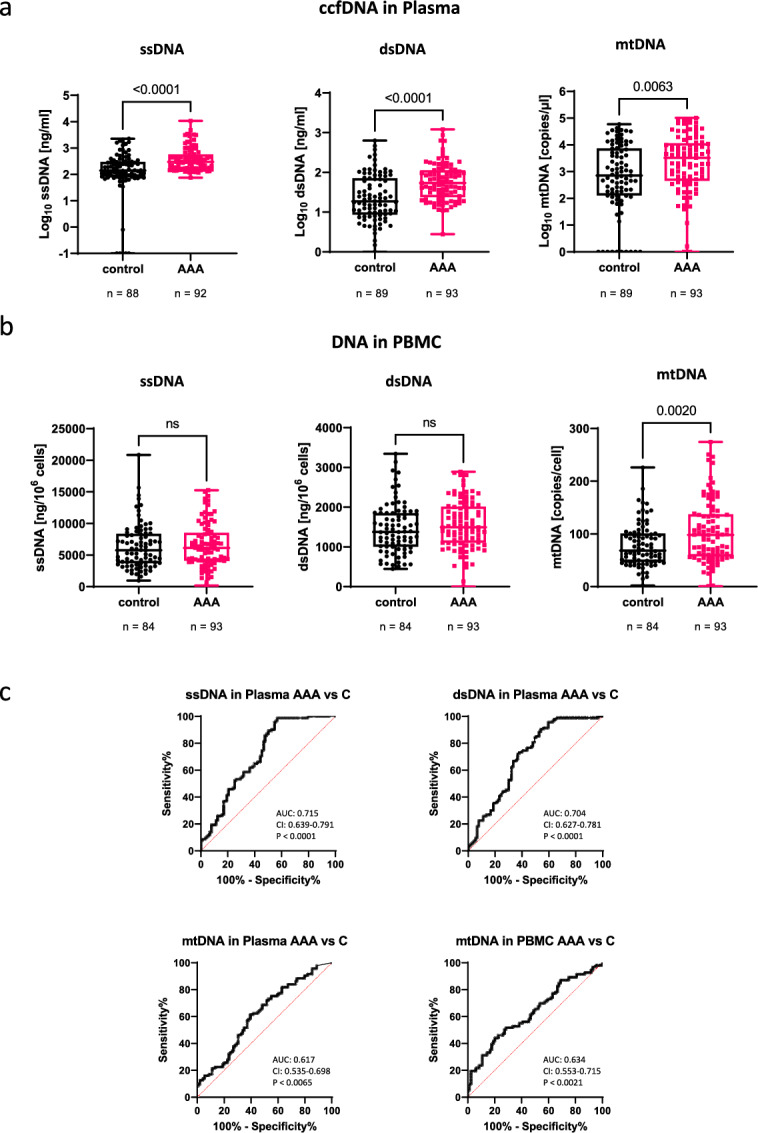
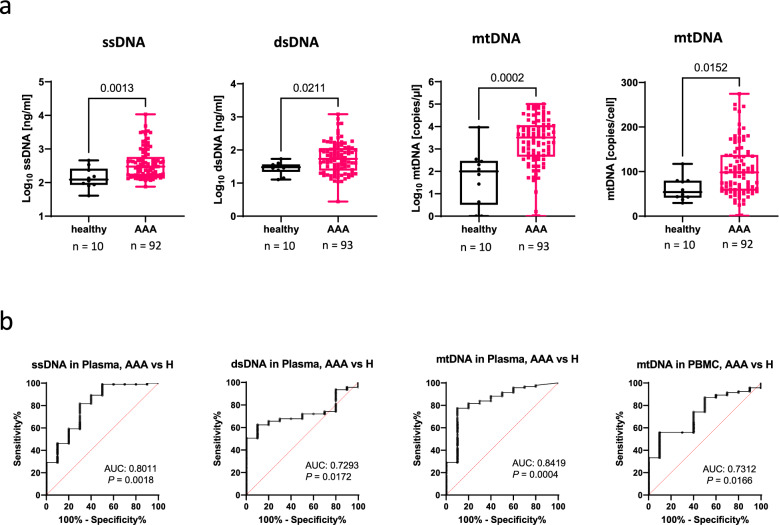
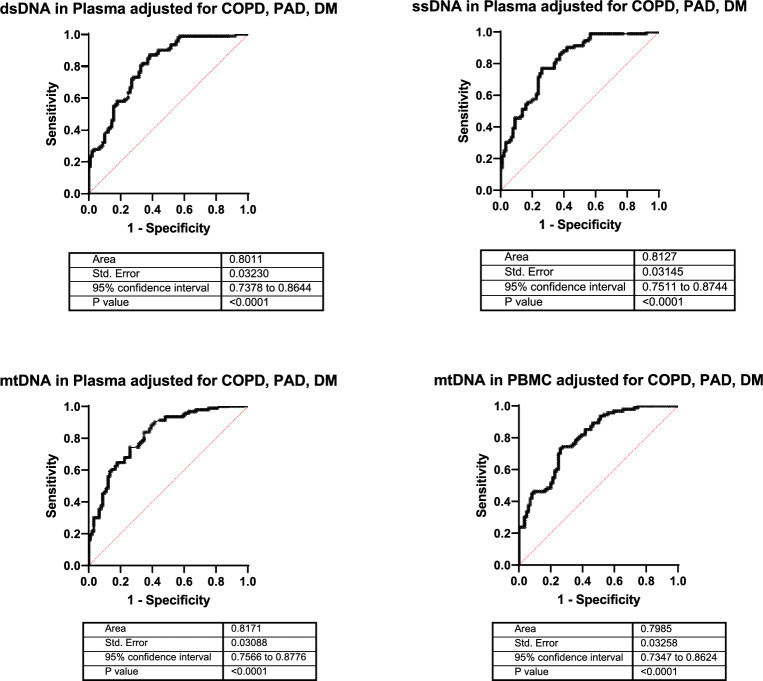
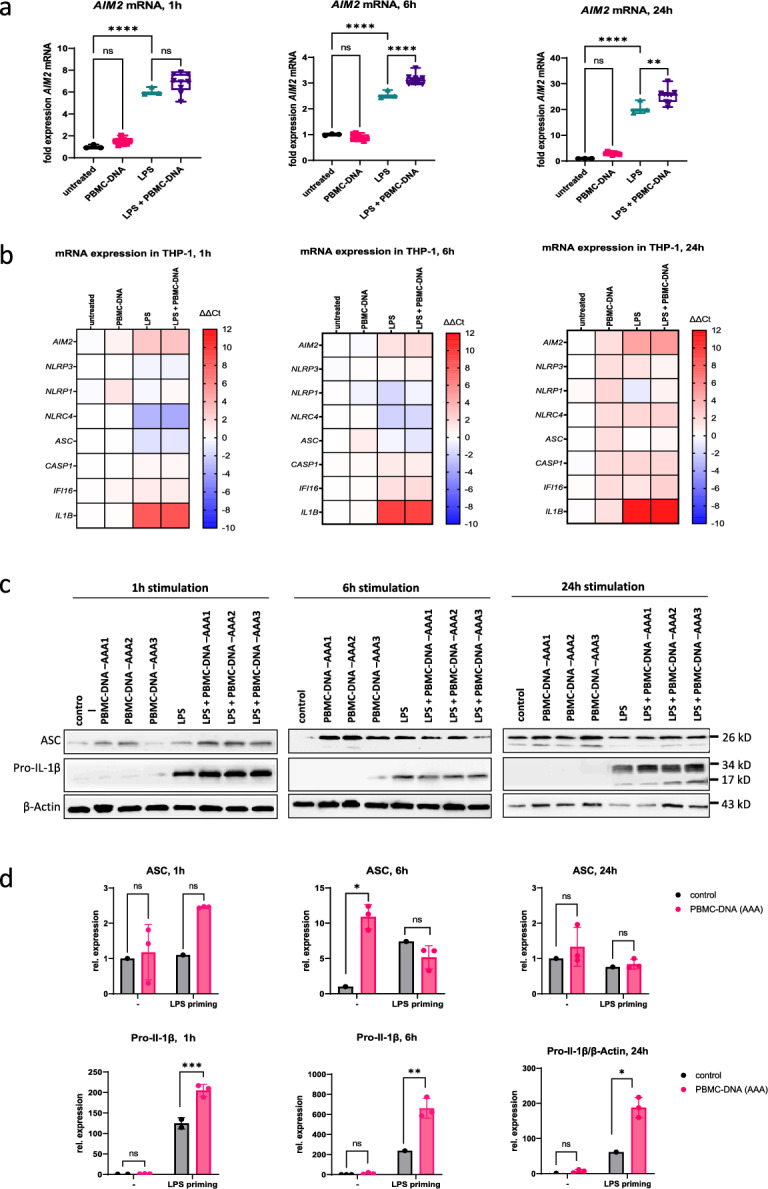
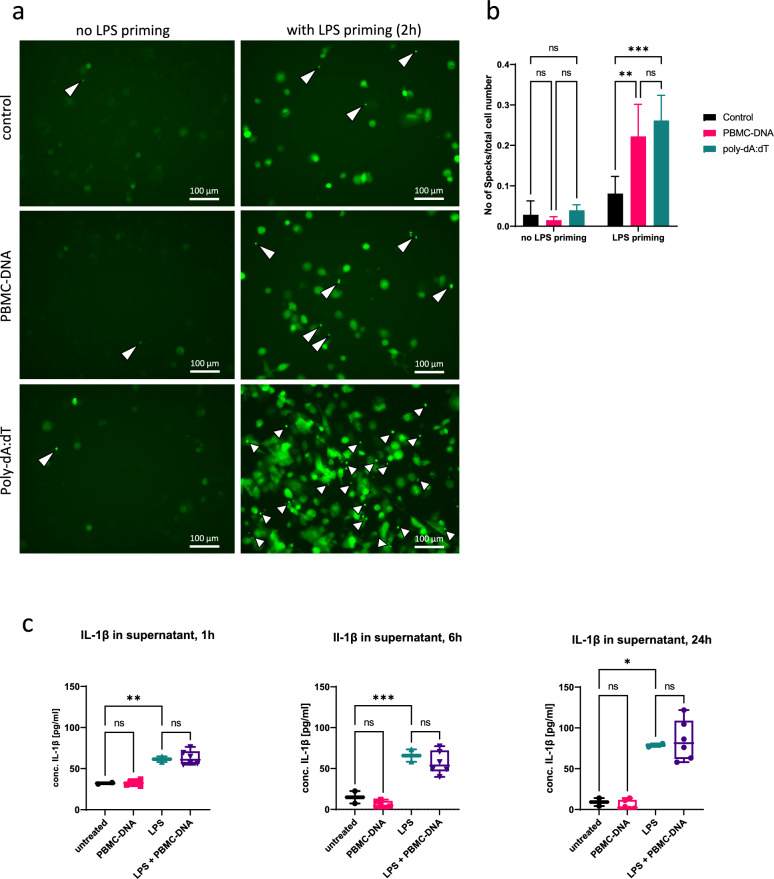
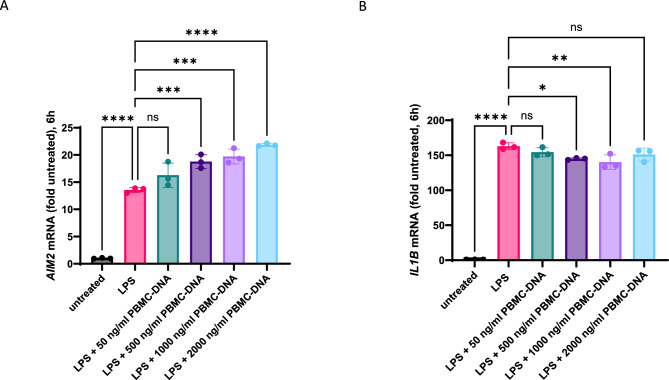
Circulating cell-free (cf) DNA in blood plasma is considered a diagnostic and prognostic biomarker of tissue damage and could be a driver of chronic inflammation by stimulating the innate immune response via activation of inflammasomes. Increased AIM2-inflammasome activity in the aortic wall is associated with abdominal aortic aneurysm (AAA). We here hypothesized that cfDNAs are elevated in the plasma of AAA patients and are associated with chronic inflammation. Single strand (ss)DNA, double strand (ds)DNA and mitochondrial (mt)DNA levels were explored in plasma and leucocytes from 93 AAA patients, 89 controls (non-AAA patients) and 10 healthy subjects, using fluorescence-based quantification and real-time qPCR, respectively. To analyse inflammasome activation by cfDNA, differentiated THP-1 macrophages were primed with lipopolysaccharide (LPS) and then stimulated for one, six or 24 h with DNA extracted from peripheral blood mononuclear cells (PBMC) of AAA patients. Our analysis revealed significantly increased levels of ssDNA, dsDNA and mtDNA levels in plasma from AAA patients compared with non-AAA patients and healthy subjects. In addition, the mtDNA copy number was significantly higher in PBMC from AAA patients. Stimulation of THP-1 cells with PBMC-DNA resulted in increased expression of inflammasome genes, especially the DNA sensors AIM2 and IFI16. At early time points, PBMC-DNA stimulated THP-1 showed significantly increased apoptosis-associated speck-like protein with a CARD (ASC) and Pro-Interleukin-1β protein levels compared to untreated or only LPS-primed cells, resulting in the formation of significantly more ASC specks after 24 h, a sign of inflammasome activation. We conclude from our data that cfDNA of AAA patients triggers a proinflammatory response in macrophages by activating the AIM2 inflammasome and thus could be a driving force for the chronic inflammation observed in these patients.

Keywords: AIM2; Abdominal aortic aneurysm; Biomarker; Cell free DNA; Inflammasome; Proinflammatory response; THP-1 cells; mtDNA.


Conflict of interest statement

Declarations. Competing interest: The authors declare no competing interests. Ethical approval and consent to participate: The study was conducted according to the Code of Ethics of the World Medical Association (Declaration of Helsinki). All participants gave their written informed consent to the study, which was approved by the ethical committee of the University of Heidelberg (S-091/2021) and (S-310/2013 “Etablierung einer humanen vaskulären Biomaterialbank (VBBH) an der Klinik für Gefäßchirurgie und endovaskuläre Chirurgie der Universitätsklinik Heidelberg), and amendments.

Figures

Fig. 1
Fig. 1
Comparison of DNA levels in plasma and in PBMC from AAA patients and controls. DNA was isolated from plasma, processed and quantified as described in the Materials and Methods section. (A) Levels of ssDNA, dsDNA and mtDNA in the plasma from AAA patients (red) and control patients (black). For dsDNA and mtDNA, n = 89 control samples and n = 93 AAA samples were used for analysis; For ssDNA, n = 88 control and 92 AAA samples were used for analysis. One sample in each group was excluded, here because of obvious measurement error. Statistics: Mann Whitney test with two-tailed P-value; each box plot shows all values as well as the upper quartile, the median, the lower quartile, minimum and maximum. (B) Copy numbers of mtDNA/cell are increased in PBMC from AAA patients. Note that the y-axes in A are depicted as a logarithmic scale. Statistics: Mann Whitney test with two-tailed P-value; each box plot shows all values as well as the upper quartile, the median, the lower quartile, minimum and maximum n = 93 AAA samples and n = 84 control samples. (C) Receiver operator characteristic (ROC) curves of ssDNA, dsDNA, or mtDNA in plasma and of mtDNA copies in PBMC, of the AAA group vs the control group (non-AAA), without adjustment for co-morbidities. AUC: Area under the curve. CI: confidence interval. P: P value. Data were plotted using GraphpadPrism software 9.0.0.
Fig. 2
Fig. 2
Comparison of DNA levels in plasma and in PBMC from AAA patients and healthy subjects. DNA was isolated from plasma, processed and quantified as described in the Materials and Methods section. (A) Levels of ssDNA, dsDNA and mtDNA in plasma as well as copy numbers of mtDNA/cell in PBMC of AAA patients (red) and controls (black). For analysis of the dsDNA levels in plasma, mtDNA copies in plasma and mtDNA copies in PBMC, n = 93 AAA samples and n = 10 control samples were included. For ssDNA, n = 10 control and 92 AAA samples were used for analysis. One sample was excluded from each group because of obvious measurement error. Statistics: Mann Whitney test with two-tailed P value; each box plot shows all values as well as the upper quartile, the median, the lower quartile, minimum and maximum (B). Receiver operator characteristic (ROC) curves of ssDNA, dsDNA, or mtDNA in plasma and of mtDNA copies in PBMC, of the AAA group vs the healthy subject group, without adjustment for co-morbidities. AUC: Area under the curve. CI: confidence interval. P: P value. Data were plotted using GraphpadPrism software 9.0.0.
Fig. 3
Fig. 3
Receiver operator characteristic (ROC) curves of ssDNA, dsDNA, or mtDNA in plasma and of mtDNA copies in PBMC, of the AAA group vs the control group (non-AAA), after adjustment for co-morbidities. Data were plotted using GraphpadPrism software 9.0.0. AUC: Area under the curve. CI: confidence interval. P: P value. COPD: chronic obstructive pulmonary disease, PAD: peripheral artery disease, DM: Diabetes mellitus.
Fig. 4
Fig. 4
Inflammasome activation by PBMC-DNA in THP-1 cells. THP-1 cells were differentiated with 20 nM phorbol-12-myristate-13-acetate (PMA) for two days and subsequently stimulated with vehicle, or 50 ng/ml PBMC-DNA from AAA-patients (n = 3), in the presence or absence of 100 ng/ml LPS (for 6h or 24h as indicated). For 1h stimulation, PMA-differentiated cells were left untreated or primed for 2h with 200 ng/ml LPS before stimulation (A) Relative expression of AIM2 mRNA (fold change vs. untreated), as determined by RT-qPCR. Data are shown as box plots of n = 3 (untreated, LPS treated) to 9 (PBMC-DNA, LPS + PBMC-DNA) ΔΔCT values. Statistics: Ordinary one-way ANOVA with adjusted P-values (Šídák’s multiple comparison test) (B) Relative expression of inflammasome genes in PMA-differentiated THP-1 after stimulation with vehicle, or 50 ng/ml PBMC-DNA from AAA-patients (n = 3), in the presence or absence of LPS. Data were normalized to untreated control and means are shown as a heatmap. n = 3 (untreated, LPS treated) to 9 (PBMC-DNA, LPS + PBMC-DNA). ΔΔCT values were used for calculation of reach relative expression. (C) Representative immunoblot analysis of ASC, Pro-Caspase-1 and Pro-IL1β in THP-1 cell lysates after stimulation. (D) Normalized amount of ASC and Pro-Il-1β protein expression derived from immunoblotting. Red bars show the means of three PBMC-DNAs. Data were normalized to the expression of β-Actin and shown as fold expression of control. Statistics: Two-way ANOVA with adjusted p-values (Šídák’s multiple comparison test). ns: not significant, * P < 0.05, ** P < 0.01, *** P < 0.001, **** P < 0.0001.
Fig. 5
Fig. 5
Inflammasome activation by PBMC-DNA in THP-1-ASC-GFP cells (A) Representative fluorescence micrographs of ASC specks induced by PBMC-DNA in THP-1-ASC-GFP. THP-1-ASC-GFP cells were differentiated with 20 nM phorbol-12-myristate-13-acetate (PMA) for two days, primed for 2h with 200 ng/ml LPS or vehicle, and stimulated for 24h with vehicle, or 50 ng/ml PBMC-DNA from AAA-patients (n = 3). White arrows point to ASC specks, representing inflammasomes. Images were taken with a Keyence microscope at an original magnification of 200x. (B) Quantification of ASC specks per cell number (n = 3 to 9 images per treatment). Statistics: Two-way ANOVA with adjusted P-values (Tukey’s multiple comparison test) (C) Release of IL-1β into the supernatant of THP-1 cells, derived from the experiments in Fig. 1. Concentration of IL-1β was determined by ELISA. Data are derived from three biological replicates analysed in triplicate. Statistical analysis was performed by ordinary one-way ANOVA with subsequent Šídák’s multiple comparison test (1h and 6h) or by mixed-effect analysis (24h). ns: not significant, * P < 0.05, ** P < 0.01, *** P < 0.001.
Fig. 6
Fig. 6
AIM2 expression in response to increasing doses of PBMC-DNA containing high mtDNA levels (mtDNAhigh-mix). Expression of AIM2 mRNA (A) and IL1B mRNA (B) was determined by RT-qPCR using specific primers. A strong induction of AIM2 mRNA was observed after 1h priming with 100 ng/ml LPS. After additional stimulation for 5 h with increasing doses of the mtDNAhigh-mix, AIM2 mRNA expression was further increased. Statistical analysis was performed by ordinary one-way ANOVA with subsequent Šídák’s multiple comparison test. ns: not significant, * P < 0.05, ** P < 0.01, *** P < 0.001, **** P < 0.0001.

Similar articles

References

    1. Stroun, M., Anker, P., Maurice, P. & Gahan, P. B. Circulating nucleic acids in higher organisms. Int. Rev. Cytol.51, 1–48. 10.1016/s0074-7696(08)60225-9 (1977). - PubMed
    1. Thierry, A. R., El Messaoudi, S., Gahan, P. B., Anker, P. & Stroun, M. Origins, structures, and functions of circulating DNA in oncology. Cancer Metastasis Rev.35, 347–376. 10.1007/s10555-016-9629-x (2016). - PMC - PubMed
    1. de Miranda, F. S. et al. Properties and application of cell-free DNA as a clinical biomarker. Int. J. Mol. Sci.10.3390/ijms22179110 (2021). - PMC - PubMed
    1. Tsuji, N. & Agbor-Enoh, S. Cell-free DNA beyond a biomarker for rejection: Biological trigger of tissue injury and potential therapeutics. J. Heart Lung Transplant40, 405–413. 10.1016/j.healun.2021.03.007 (2021). - PubMed
    1. Pisareva, E. et al. Comparison of the structures and topologies of plasma extracted circulating nuclear and mitochondrial cell-free DNA. Front. Genet.14, 1104732. 10.3389/fgene.2023.1104732 (2023). - PMC - PubMed

LinkOut - more resources