. 2025 Jun 20;8(1):946.
doi: 10.1038/s42003-025-08352-w.

Molecular features defining the efficiency of bioPROTACs

Affiliations

Molecular features defining the efficiency of bioPROTACs

Dorothea Winkelvoß et al. Commun Biol. .

Abstract

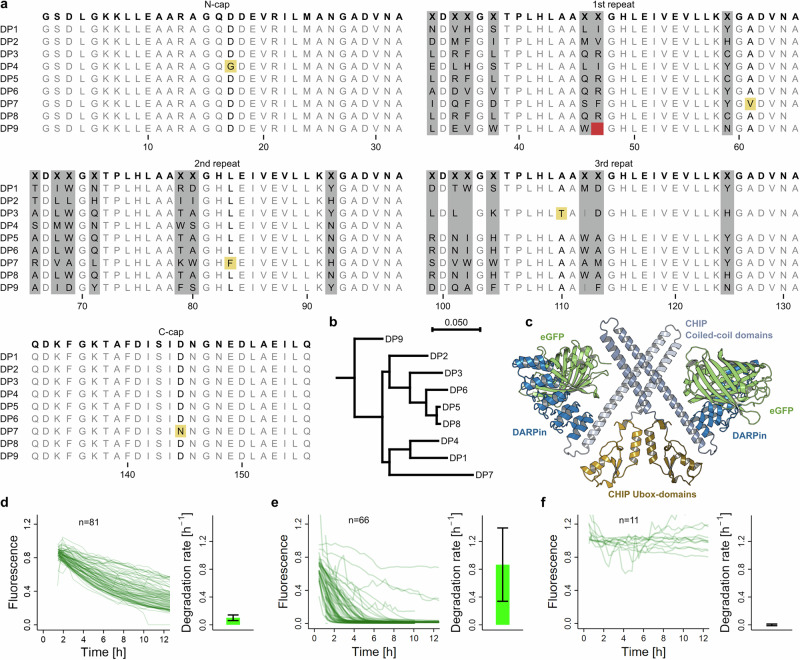
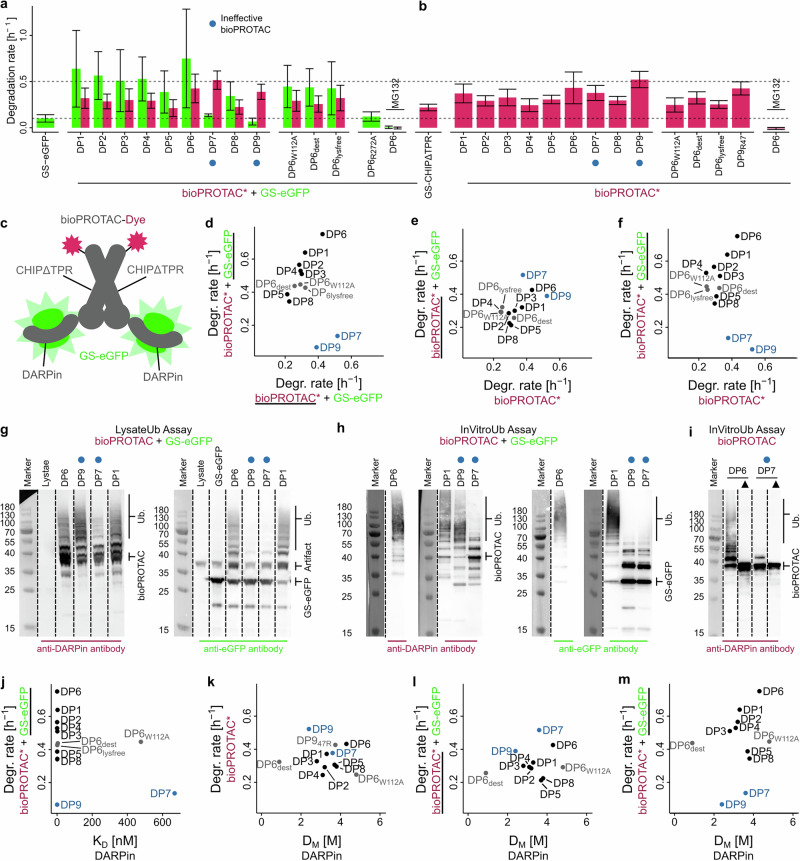
BioPROTACs consist of a target-binding unit and a component of the ubiquitin-proteasome system. However, the specific biophysical features influencing their effectiveness are poorly understood. We investigated the design principles defining the target-binding moiety of bioPROTACs. We used our recently developed assay for accurately measuring degradation rates, based on microinjection and live-cell microscopy, independent of other confounding factors like biosynthesis and transport. We used a very efficient UPS interaction domain from CHIP E3 ligase, and 9 different well-characterized DARPins to test degradation of the proof-of-principle target eGFP. All but two DARPins work well in this context, one sterically preventing E2 binding in the complex, the other overlapping with the target ubiquitination epitope. Affinity and thermodynamic stability of the binders had only a modest role. BioPROTACs constructed in this way were able to degrade eGFP catalytically. DARPins by themselves could also accelerate degradation of bound GFP, using other cellular E3 systems, but in a non-catalytic manner. The most important factor for efficient degradation by a bioPROTAC in trans is the correct orientation of the complex for target ubiquitination and presentation to the proteasome, still to be determined empirically. The strategies developed here show an efficient pathway to characterize and optimize such systems.


Conflict of interest statement

Competing interests: The authors declare no competing interests.

Figures

Fig. 1
Fig. 1. DARPins used in Ubox-based bioPROTACs and degradation rate determination by fluorescence measurement.
a Sequence alignment of eGFP-binding DARPins. The library consensus is shown in bold letters on the top. Randomized positions are highlighted in gray and labeled with character “X”. Mutations outside of randomized regions, acquired by directed evolution, are colored in yellow. A deletion in the 1st repeat of DP9 is colored in red. b Dendrogram of DARPin sequences created in CLC with tree construction method of neighbor joining and Jukes-Cantor protein distance measure. c Model of a CHIP-based dimeric bioPROTAC/eGFP complex. The monomer bioPROTAC structures were produced using AlphaFold and consist of the N-terminal DARPin (blue), followed by the CHIP E3 ligase coiled-coil region (light and dark gray) and Ubox-domain (light and dark yellow) that interact with E2 enzymes (not shown). The orientation of the two monomeric CHIPΔTPR domains is taken from the structure PDB ID: 2F42. The DARPin:GFP orientation is derived from PDB ID: 5MAD. df Representative single cell fluorescence signals of cells injected with specific analyte (respective left graphs) and mean rate constant derived from exponential decay fit of the single cell fluorescence signals (respective right graphs); error bars represent standard deviations. d GS-eGFP injection from one exemplary experiment. e DP6-bioPROTAC+GS-eGFP. f DP6-bioPROTAC+GS-eGFP with added proteasome inhibitor.
Fig. 2
Fig. 2. Design and mechanism of bioPROTACs, based on genetic fusion of DARPins and CHIP E3 ligase.
Asterisks (*) indicate dye label. a, b Mean degradation rate constants of DARPin-CHIPΔTPR bioPROTACS, labeled with TMR dye (red bars), either alone (b) or in a one-to-one complex with GS-eGFP (green bars, a), determined by microinjection into HEK293 cells. Error bars represent standard deviations. Numbers of analyzed cells per analyte are shown in Supplementary Table ST1. Ineffective bioPROTACs are indicated by a blue circle. c Graphical representation of labeled DARPin-CHIPΔTPR bioPROTAC dimer in complex with GS-eGFP used for degradation determination. df Plots comparing the indicated degradation rate constants shown in (a, b), each axis shows the underlined compound. gi Western blot images of ubiquitination reactions. Samples were detected with either anti-eGFP antibody or anti-DARPin polyclonal antibody to show GS-eGFP or bioPROTAC ubiquitination. Shown are images from single experiments. To image marker bands and antibody-stained bands, the same membranes were imaged in two separate channels. Uncropped membranes are shown in Supplementary Fig. S17. g Western blot images resulting from the LysateUb assay, based on HEK293 lysates and involving GS-eGFP/bioPROTAC complexes. h, i Western blot images of InVitroUb assays, an in vitro ubiquitination assay with purified E1, E2 and ubiquitin with bioPROTACs (i) or GS-eGFP/bioPROTAC complexes (h). Black triangle (▲) shows controls without added ubiquitination reaction components. j Graph comparing DARPin affinities determined by SPR with indicated degradation rate constant of GS-eGFP. km Comparison of DARPin denaturation midpoints, determined by guanidinium-induced unfolding, and degradation rate constants. Pearson’s correlation coefficients (r) are 0.86 for (d) when ignoring the two outliers in blue, 0.58 for (e), and 0.70 for (f) when ignoring the two outliers in blue. The r values for jm are between 0.21 and −0.41, therefore not supporting a correlation. For a and b, the number of analyzed cells are shown in Supplementary Table ST1.
Fig. 3
Fig. 3. DARPin binding epitopes and GS-eGFP ubiquitination.
a Mass spectrometric analysis (MS-MS) of ubiquitination sites after in vitro ubiquitination of GS-eGFP, induced by DP6-based bioPROTAC. The sample was digested in the three indicated ways to improve coverage. Ubiquitinated lysines carry a covalent GG or LRGG adduct and are circled in different colors. For representative spectra, see Supplementary Fig. S27. b Structure of eGFP (gray, PDB ID: 5MAD) in complex with DP6 (yellow, PDB ID: 5MA6) and DP9 (blue, PDB ID: 5MAD) created in PyMOL. To create bioPROTACs, the CHIPΔTPR domain is genetically fused at the indicated C-terminus. GS-eGFP N- and C-termini are shown in black and purple, respectively. eGFP lysine ubiquitination sites upon DP6-bioPROTAC engagement are indicated in the same colors as shown in (a). The C-terminal K241 is not indicated, since the residue is not resolved in the structure, but close to the indicated C-terminus (M233, purple). ce Assays involving GS-eGFP mutants. GS-eGFP_mut1: K104R_K159R, GS-eGFP_mut2: K6R_K104R_K159R, GS-eGFP_mut3: K104R_K159R_K241R, GS-eGFP_mut4: K6R_K104R_K159R_K241R. c Western-blot of InVitroUb ubiquitination assay of DP6-bioPROTAC in complex with indicated GS-eGFP lysine mutants. Samples were detected with either anti-eGFP antibody or anti-DARPin polyclonal antibody to show GS-eGFP or bioPROTAC ubiquitination. To image marker bands and antibody-stained bands, the same membranes were imaged in two separate channels. Uncropped membranes are shown in Supplementary Fig. S17. d Degradation rate constants determined by microinjection into HEK293 cells of GS-eGFP and GS-eGFP mutants alone (/) or in complex with DP6-bioPROTAC or inactive DP6-bioPROTACR272A mutant. Shown are average degradation rate constants of single cells. Error bars represent standard deviations. Numbers of analyzed cells per analyte are shown in Supplementary Table ST1. The four lysines or arginines within the GS-eGFP mutants are color-coded according to mutated lysine residues as shown in (a) and (b). e Western-blot of LysateUb ubiquitination assay of DP6-bioPROTAC or inactive DP6-bioPROTACR272A mutant alone or in complex with indicated GS-eGFP lysine mutants. Samples were detected by anti-eGFP antibody to show GS-eGFP ubiquitination. fk Structures of indicated DARPins (blue) in complex with eGFP (gray) determined by x-ray crystallography. PDB IDs: DP1 9F22, DP2 9F23, DP3 6MWQ, DP4 9F24, DP6 5MA6 (differs in 5 mutations in the C-cap compared to our construct), DP9 5MAD. Models of DP5, DP7, and DP8 are shown in Supplementary Fig. S30. Crystallographic data are shown in Table 2. For d, the number of analyzed cells are shown in Supplementary Table ST1.
Fig. 4
Fig. 4. Influence of DARPin binding on GS-eGFP degradation.
ac Degradation rate constants of different DARPins or DARPin/GS-eGFP complexes. Shown are average degradation rate constants of single cells as determined upon microinjection of one-to-one complexes into the cytosol of living cells in combination with fluorescent live-cell imaging. Error bars indicate standard deviations. Numbers of analyzed cells per analyte are shown in Supplementary Table ST1. a Unlabeled DARPin/GS-eGFP complexes, GS-eGFP degradation rates shown in green. b DARPins C-terminally labeled with TMR dye (red bars) in complex with GS-eGFP (green bars). Asterisk (*) indicates dye label. c DARPins injected alone, C-terminally labeled with TMR dye (red bars). d, e Comparison of indicated degradation rate constants from (ac). f Comparison of DARPin denaturation midpoints determined by GdmCl-induced equilibrium unfolding with DARPin degradation rates from (c). DP6 and DP9 and their variants with destabilizing and stabilizing mutations are shown in gold and cyan. g Degradation rate ratios within complexes of DARPin/GS-eGFP shown in (b) and bioPROTAC/GS-eGFP complexes from Fig. 2a. h Exemplary western blot of ubiquitination assays of DARPin/GS-eGFP complexes in HEK293 lysate performed as biological triplicates. Samples were split and loaded onto two separate SDS-PAGE gels for western-blotting with anti-eGFP antibody or anti-DARPin serum to show GS-eGFP or DARPin ubiquitination. To image marker bands and antibody-stained bands, the same membranes were imaged in two separate channels. Uncropped membranes are shown in Supplementary Fig. S17. i Quantification of GS-eGFP (green bars) and DARPin (pink bars) ubiquitination intensities from blots shown in (h) as well as two replicates shown in Supplementary Fig. S35. Error bars represent standard deviations derived from three biological replicates. Quantification was performed using the unedited blots shown in Supplementary Fig. S17. Ubiquitination signal intensities (upper rectangle) was normalized to the respective GS-eGFP or DARPin band (lower rectangle). A one-way ANOVA coupled with Tukey’s multiple comparison test was used to test for significance of differences within pairs of data. Significant differences are shown by an asterisk (*). j Crystal structure of DP6/eGFP complex (PDB ID: 5MA6). Mutated residues for DP6dest are shown in blue (L8A in each repeat) and red (L24A in each repeat) and W112 as critical interacting residue is shown in yellow. ko Degradation rate constants of DP6 variants alone and in complex with GS-eGFP. Asterisks (*) indicate dye label. k DP6 variants alone, C-terminally labeled with TMR dye. l DP6 variants C-terminally labeled with TMR dye (red bars) in complex with GS-eGFP (green bars). m Degradation rates of unlabeled DP6 variants in complex with GS-eGFP. n Degradation rates of DP6 variants in complex with GS-eGFP with inhibitor controls and N-terminal acetylation. o Degradation rates of DP1 and DP4 variants in complex with GS-eGFP. Pearson’s correlation coefficients (r) are 0.68 for (e) and 0.97 for (g). In contrast, r values are 0.16 for (d) and −0.38 for (f), therefore not supporting a correlation. For ac and ko, the number of analyzed cells are shown in Supplementary Table ST1.

References

    1. Yen, H.-C. S., Xu, Q., Chou, D. M., Zhao, Z. & Elledge, S. J. Global protein stability profiling in mammalian cells. Science322, 918–923 (2008). - PubMed
    1. Komander, D. & Rape, M. The ubiquitin code. Ann. Rev. Biochem.81, 203–229 (2012). - PubMed
    1. McClellan, A. J., Laugesen, S. H. & Ellgaard, L. Cellular functions and molecular mechanisms of non-lysine ubiquitination. Open Biol.9, 190147 (2019). - PMC - PubMed
    1. George, A. J., Hoffiz, Y. C., Charles, A. J., Zhu, Y. & Mabb, A. M. A comprehensive atlas of E3 ubiquitin ligase mutations in neurological disorders. Front. Genet.9, 29 (2018). - PMC - PubMed
    1. Guharoy, M., Bhowmick, P., Sallam, M. & Tompa, P. Tripartite degrons confer diversity and specificity on regulated protein degradation in the ubiquitin-proteasome system. Nat. Commun.7, 10239 (2016). - PMC - PubMed

MeSH terms

Substances

LinkOut - more resources