

Influence of migrasome-associated long noncoding RNAs on the immune microenvironment and prognosis in lung adenocarcinoma
- PMID: 40542304
- PMCID: PMC12181520
- DOI: 10.1007/s12672-025-03000-5
Influence of migrasome-associated long noncoding RNAs on the immune microenvironment and prognosis in lung adenocarcinoma
Abstract
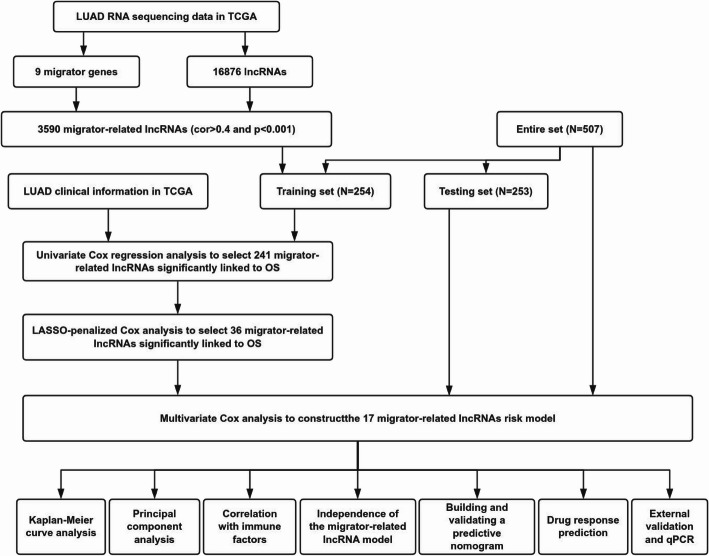
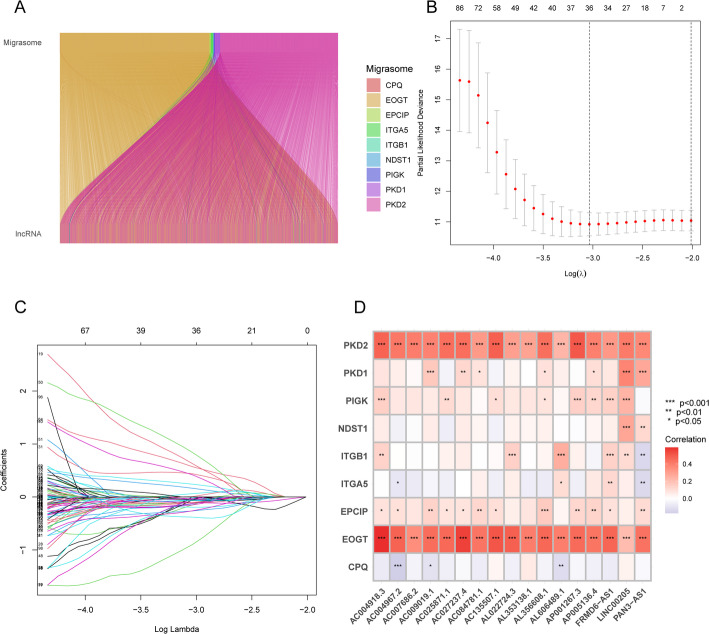
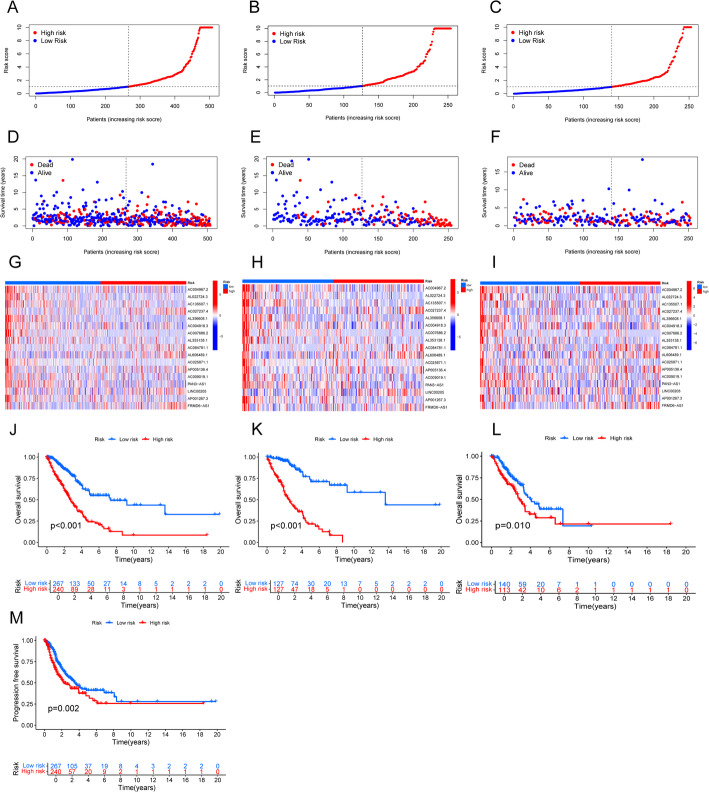
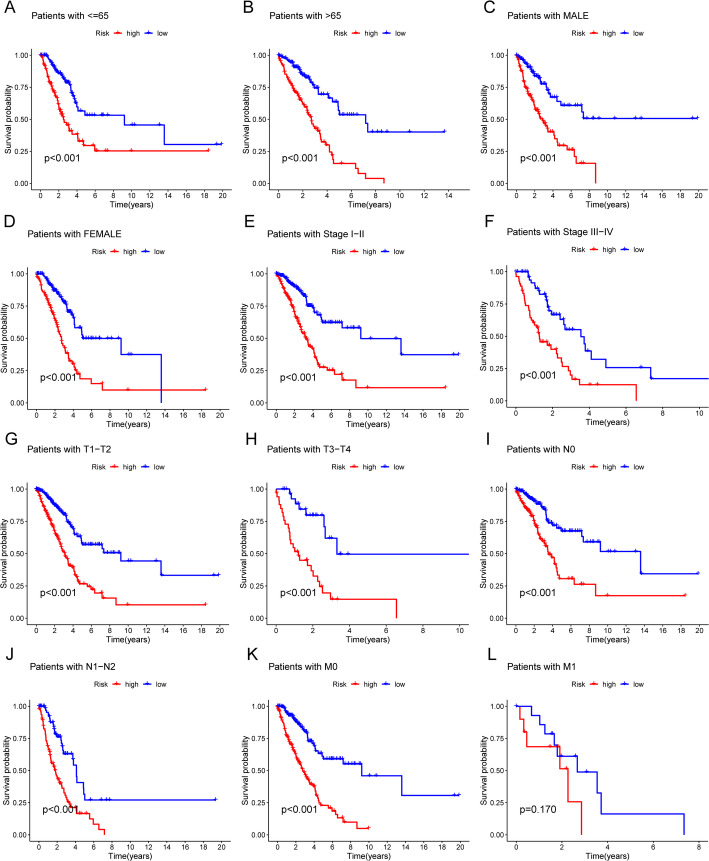
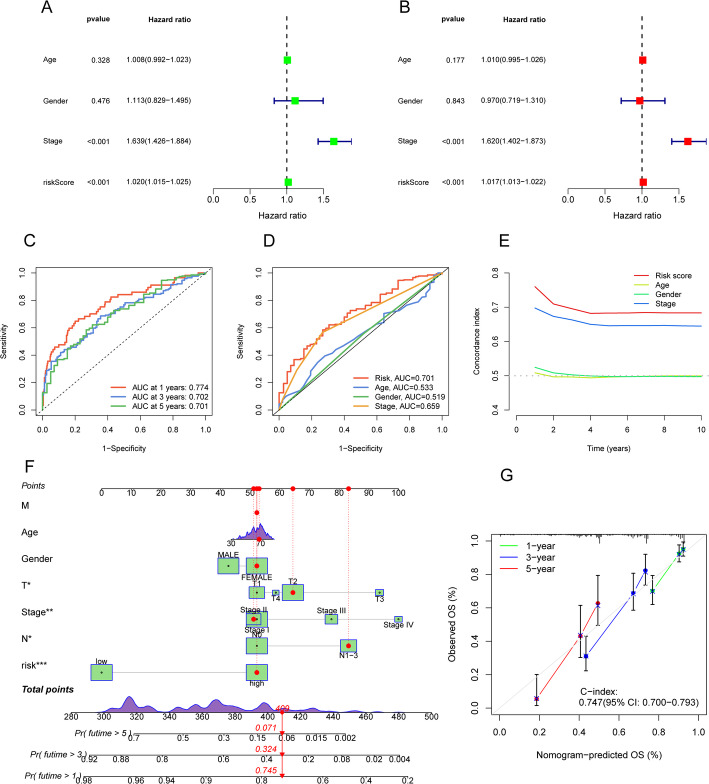
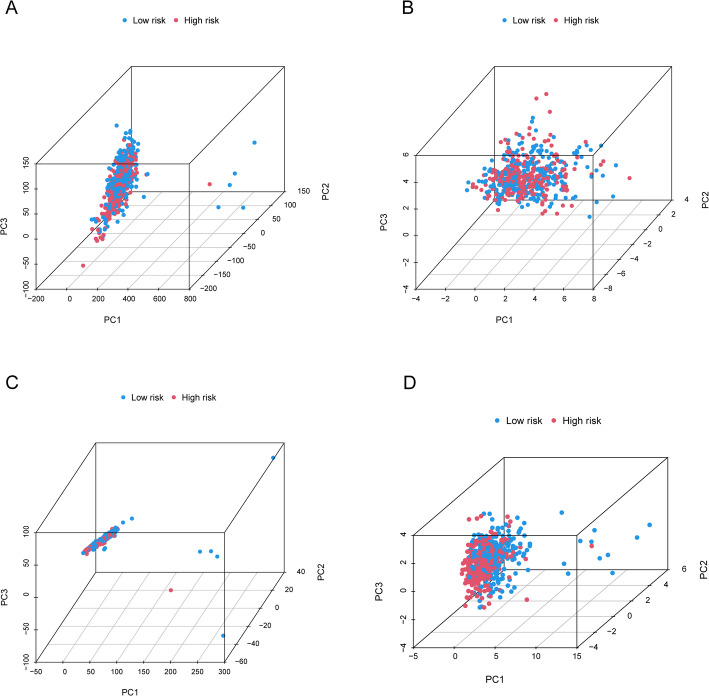
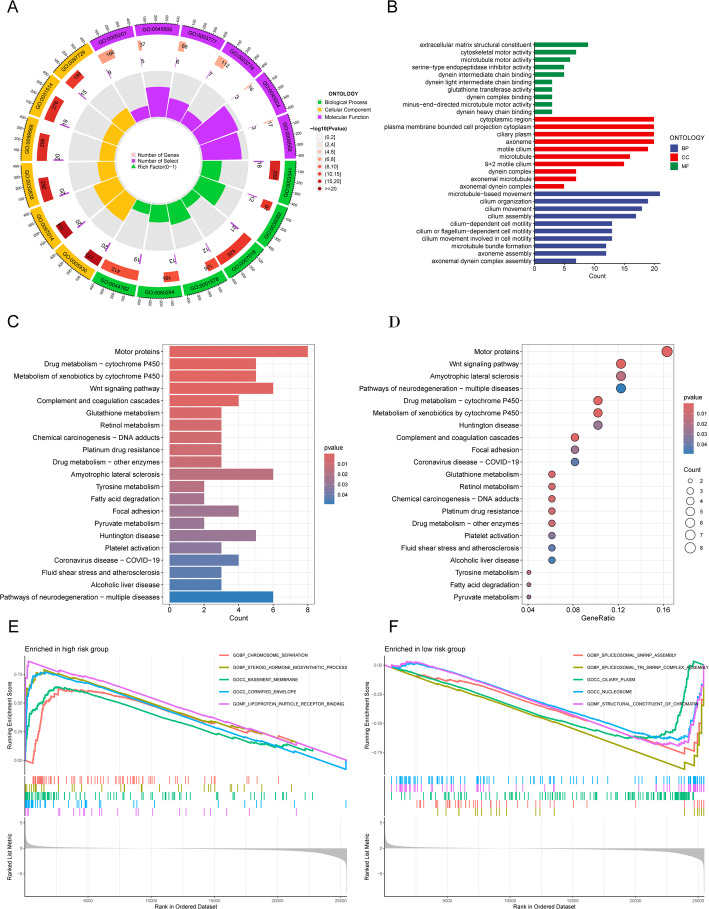
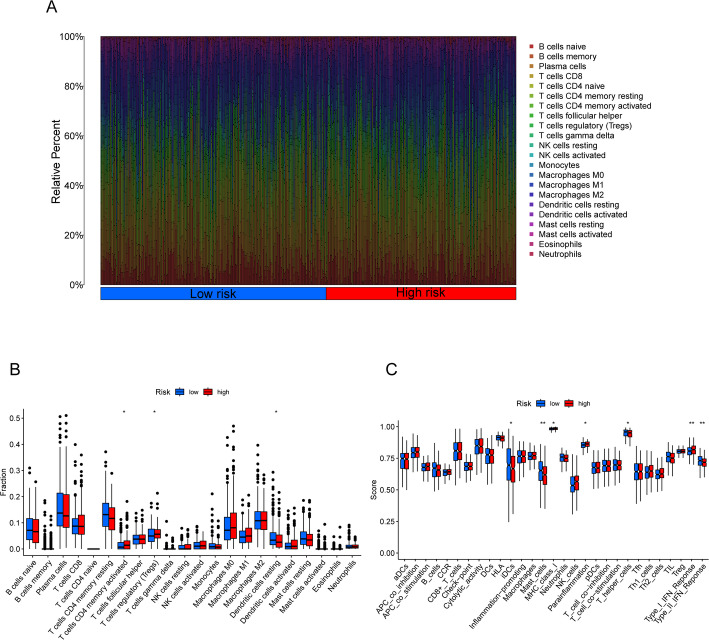
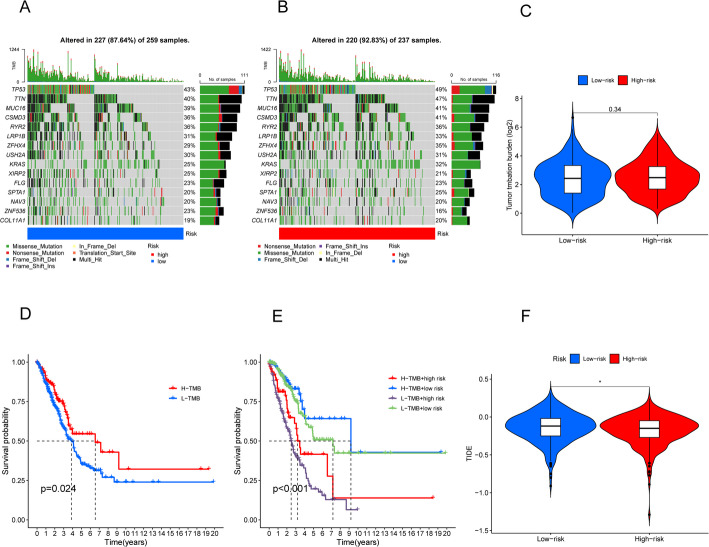
This study investigated the prognostic impact of migrasome-related long noncoding RNAs (lncRNAs) in lung adenocarcinoma (LUAD). We analyzed transcriptomic data from The Cancer Genome Atlas (TCGA) database, comprising 541 tumor samples and 59 normal tissue samples, to pinpoint key migrasome genes and related lncRNAs, using correlation analysis to detect those pertinent to patient outcomes. A risk score model based on 17 migrasome-related lncRNAs, constructed via univariate, LASSO, and multivariate Cox regression, was then validated in an independent dataset to ensure reliability. Our findings revealed that high-risk patients exhibited worse overall and progression-free survival, alongside altered immune features, such as potential immune evasion and an increased propensity for immunotherapy responsiveness. Moreover, Tumor Immune Dysfunction and Exclusion (TIDE) analyses suggested that individuals with higher scores could experience greater benefit from immune checkpoint inhibitors. Functional enrichment analysis supported the engagement of migrasome-related pathways and immune-regulatory processes that may drive disease progression. Additionally, principal component analysis (PCA) confirmed the robustness of our lncRNA-driven classifier, enabling accurate differentiation of risk cohorts. Overall, our study underscores the contribution of migrasome-related lncRNAs in predicting LUAD prognosis and informing clinical choices, shedding light on tumor biology and immunotherapy response. These results emphasize the clinical importance of migrasome-related lncRNAs as promising therapeutic targets and prognostic biomarkers in LUAD management.
Keywords: Immunotherapy; LUAD; LncRNAs; Migrasomes; Prognosis.
© 2025. The Author(s).
Conflict of interest statement
Declarations. Ethics approval and consent to participate: This study utilized publicly available data from the TCGA, GENE, and TIDE databases. As all data used in this research is de-identified and publicly accessible, no ethical approval or participant consent was required. The study was conducted in accordance with relevant guidelines and regulations for research involving secondary data. Consent for publication: Not applicable. Competing interests: The authors declare no competing interests.
Figures
Similar articles
-
Construction of a risk and prognostic model for migrasome-associated lncRNAs in renal cell carcinoma.Sci Rep. 2025 Jul 23;15(1):26760. doi: 10.1038/s41598-025-10630-w. Sci Rep. 2025. PMID: 40702098 Free PMC article.
-
Migrasome-related lncRNAs predict prognosis and immune response of clear cell renal cell carcinoma.Transl Androl Urol. 2025 May 30;14(5):1214-1229. doi: 10.21037/tau-2024-728. Epub 2025 May 27. Transl Androl Urol. 2025. PMID: 40529029 Free PMC article.
-
[Ferroptosis-related long non-coding RNA to predict the clinical outcome of non-small cell lung cancer after radiotherapy].Beijing Da Xue Xue Bao Yi Xue Ban. 2025 Jun 18;57(3):569-577. doi: 10.19723/j.issn.1671-167X.2025.03.022. Beijing Da Xue Xue Bao Yi Xue Ban. 2025. PMID: 40509836 Free PMC article. Chinese.
-
Cost-effectiveness of using prognostic information to select women with breast cancer for adjuvant systemic therapy.Health Technol Assess. 2006 Sep;10(34):iii-iv, ix-xi, 1-204. doi: 10.3310/hta10340. Health Technol Assess. 2006. PMID: 16959170
-
Impact of residual disease as a prognostic factor for survival in women with advanced epithelial ovarian cancer after primary surgery.Cochrane Database Syst Rev. 2022 Sep 26;9(9):CD015048. doi: 10.1002/14651858.CD015048.pub2. Cochrane Database Syst Rev. 2022. PMID: 36161421 Free PMC article.
References
-
- Zhou J, Xu Y, Liu J, Feng L, Yu J, Chen D. Global burden of lung cancer in 2022 and projections to 2050: incidence and mortality estimates from GLOBOCAN. Cancer Epidemiol[J]. 2024;93:102693. - PubMed
-
- Gridelli C, Rossi A, Carbone DP, et al. Non-small-cell lung cancer. Nat Rev Dis Primers[J]. 2015;1:15009. - PubMed
Grants and funding
- No. 2023JC058/Jilin Health Science and Technology Capacity Enhancement Program
- No.YDZJ202501ZYTS267;20210203186SF;20240101007JJ;YDZJ202401676ZYTS;YDZJ202301ZYTS120; YDZJ202301ZYTS200/Jilin Provincial Scientific and Technological Development Program,China
- No.YDZJ202501ZYTS267;20210203186SF;20240101007JJ;YDZJ202401676ZYTS;YDZJ202301ZYTS120; YDZJ202301ZYTS200/Jilin Provincial Scientific and Technological Development Program,China
- No.2023079/Jilin Chinese Medicine Science and Technology Program
LinkOut - more resources
Full Text Sources