. 2025 Jun 20;18(1):45.
doi: 10.1186/s13040-025-00460-x.

Heart rate transition patterns reveal autonomic dysfunction in heart failure with renal function decline: a symbolic and Markov model approach

Affiliations

Heart rate transition patterns reveal autonomic dysfunction in heart failure with renal function decline: a symbolic and Markov model approach

Namareq Widatalla et al. BioData Min. .

Abstract

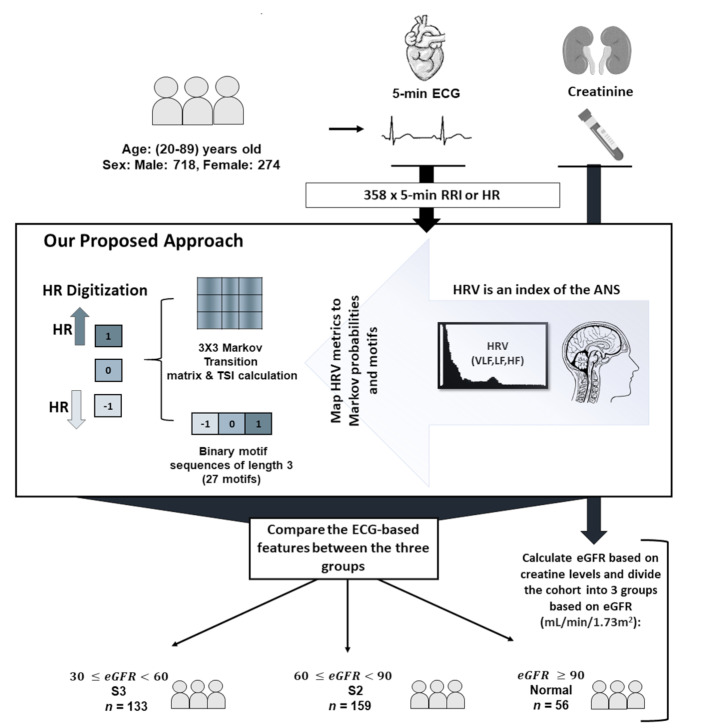
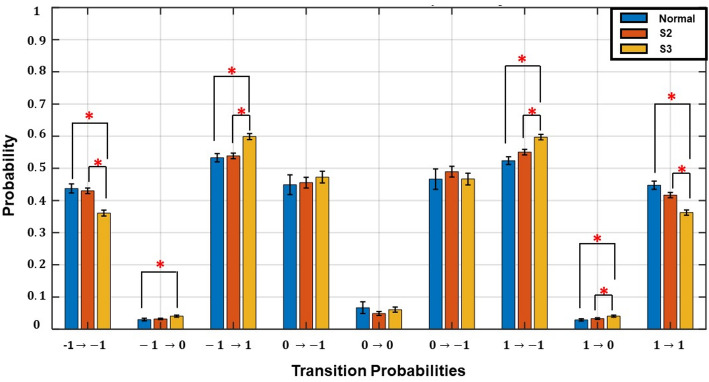
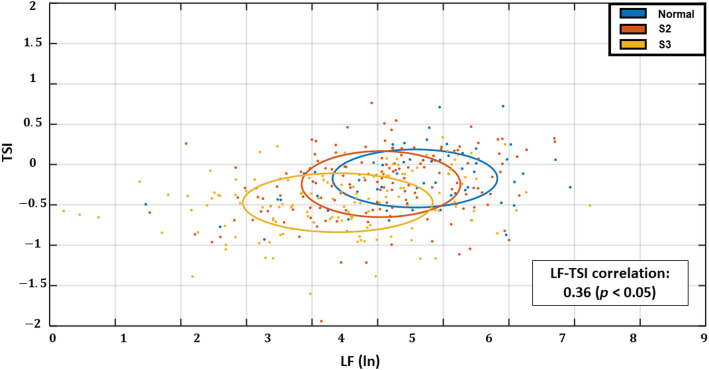
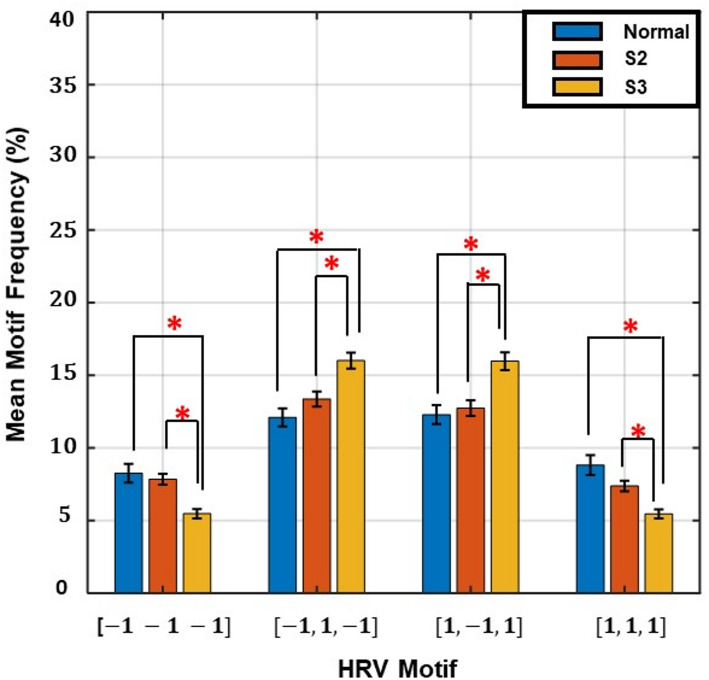
Around half of heart failure (HF) patients develop chronic kidney disease (CKD) and early detection of renal impairment in HF remains a clinical challenge. Both HF and CKD are characterized by autonomic dysfunction, suggesting that early identification of autonomic dysregulation may assist in early diagnosis and intervention. Conventional heart rate variability (HRV) metrics serve as non-invasive markers of autonomic nervous system (ANS) function; however, they are limited in their ability to capture directional and nonlinear dynamics associated with autonomic impairment during renal function decline. In this study, we digitized heart rate (HR) changes from 5-minute electrocardiogram (ECG) recordings in 358 patients with chronic HF (CHF). We applied a first-order Markov model and motif pattern analyses to compare HR transition dynamics between patients with normal and reduced estimated glomerular filtration rate (eGFR). The results revealed decreased monotonic HR transitions and increased tonic fluctuations in patients with reduced eGFR. Building on these findings, we introduced a transition stability index (TSI), which was significantly lower in patients with reduced eGFR compared to those with normal eGFR (p < 0.05). These results suggest that TSI may serve as a novel indicator of autonomic dysfunction associated with renal decline. Motif analysis further supported these findings by identifying distinctive HR transition patterns in patients with low eGFR.

Keywords: Heart failure; Heart rate transition matrix; Markov first order; Renal function.


Conflict of interest statement

Declarations. Competing interests: The authors declare no competing interests.

Figures

Fig. 1
Fig. 1
Graphical summary of the methodology. In this study, we calculated heart rates (HR) from 5-minute electrocardiogram (ECG) records of 358 chronic heart failure patients (CHF). The patients were divided based on estimated glomerular filtration rate into three groups to compare HR transition dynamics across different renal function. The dynamics were investigated after digitizing HR based on their acceleration/deceleration patterns
Fig. 2
Fig. 2
Comparison of transition probabilities for heart rate (HR) dynamics/transitions across different renal function stages. Transitions were derived using a first-order Markov model with three states: -1 (HR deceleration), 0 (no change), and 1 (HR acceleration). Significant differences between groups are indicated by red asterisks (*). The figure shows monotonic runs (-1 formula image -1, 1 formula image 1) declined, while tonic changes (-1 formula image 1, 1 formula image -1) increased with renal function decline, highlighting altered autonomic regulation
Fig. 3
Fig. 3
Transition Stability Index (TSI) vs. Low Frequency (LF) by Renal Function Stage. Scatter plot showing the relationship between log-transformed LF power and the TSI across kidney function stages. Each dot represents an individual subject, coloured by group: normal kidney function (blue), Stage 2 (S2) (orange), and Stage 3 (S3) (yellow). Ellipses indicate ± 1 standard deviation around the mean of each group, highlighting the variability in TSI and LF. The downward trend in TSI with renal function decline suggests reduced directional stability of heart rate (HR)
Fig. 4
Fig. 4
Motif frequency distribution of heart rate (HR) transition sequences across kidney function stages

Similar articles

References

    1. Ahmed A, Campbell R. Epidemiology of chronic kidney disease in heart failure. Heart Fail Clin. 2008;4(4):387–99. - PMC - PubMed
    1. Al Younis S, Hadjileontiadis L, Stefanini C, Khandoker A. Non-Invasive technologies for heart failure, systolic and diastolic dysfunction modeling: a scoping review. Front Bioeng Biotechnol. 2023;11:1261022. - PMC - PubMed
    1. Hou C. and Screening of biomarkers for diagnosing chronic kidney disease and heart failure with preserved ejection fraction through bioinformatics analysis. Biochem Biophys Rep. 2025;41:101911. - PMC - PubMed
    1. Crisanti L, Mueller C. Cardio-Renal risk stratification and acute kidney injury in acute coronary syndromes. Eur Heart J. 2025;46(1):55–7. - PubMed
    1. Shaffer F, Ginsberg J. An overview of heart rate variability metrics and norms. Front Public Health. 2017;5:258. - PMC - PubMed

LinkOut - more resources