. 2025 Jun 20;17(1):138.
doi: 10.1186/s13195-025-01783-x.

Delphinidin attenuates cognitive deficits and pathology of Alzheimer's disease by preventing microglial senescence via AMPK/SIRT1 pathway

Affiliations

Delphinidin attenuates cognitive deficits and pathology of Alzheimer's disease by preventing microglial senescence via AMPK/SIRT1 pathway

Ying Liu et al. Alzheimers Res Ther. .

Abstract

Background: Emerging evidence suggests that senescent microglia play a role in β-amyloid (Aβ) pathology and neuroinflammation in Alzheimer's disease (AD). Targeting senescent cells with naturally derived compounds exhibiting minimal cytotoxicity represents a promising therapeutic strategy.

Objectives: This study aimed to investigate whether delphinidin, a naturally occurring anthocyanin, can alleviate AD-related pathologies by mitigating microglial senescence and to elucidate the underlying molecular mechanisms.

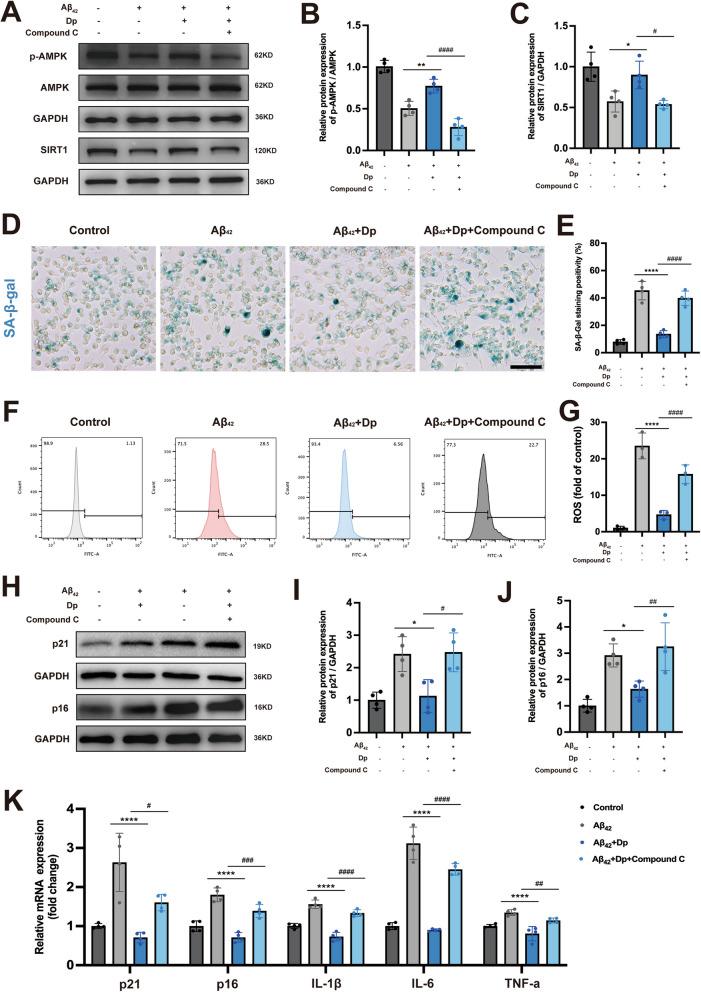
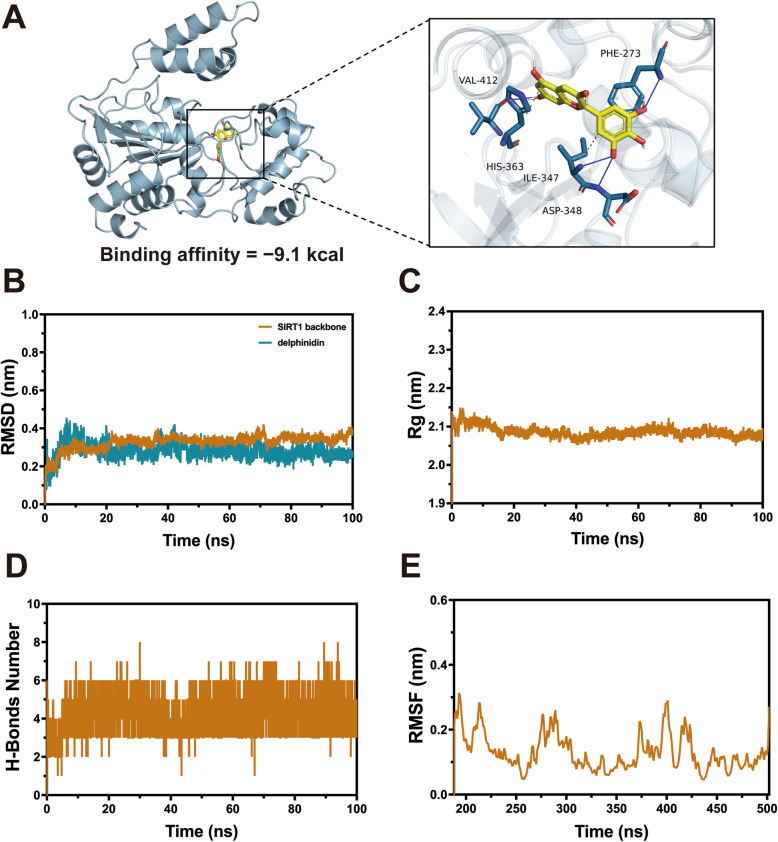
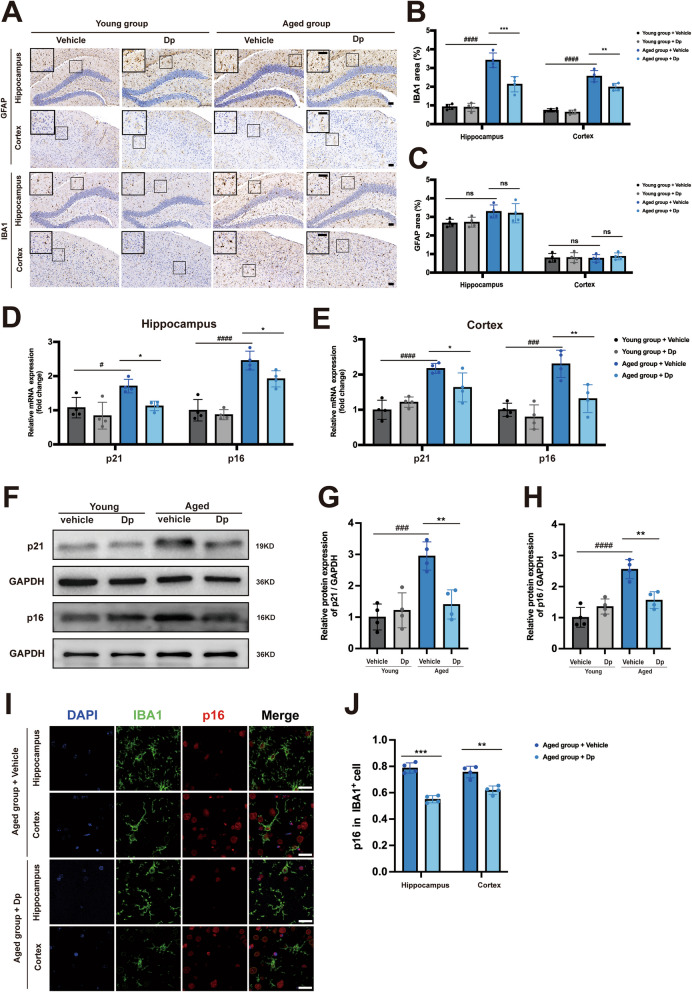
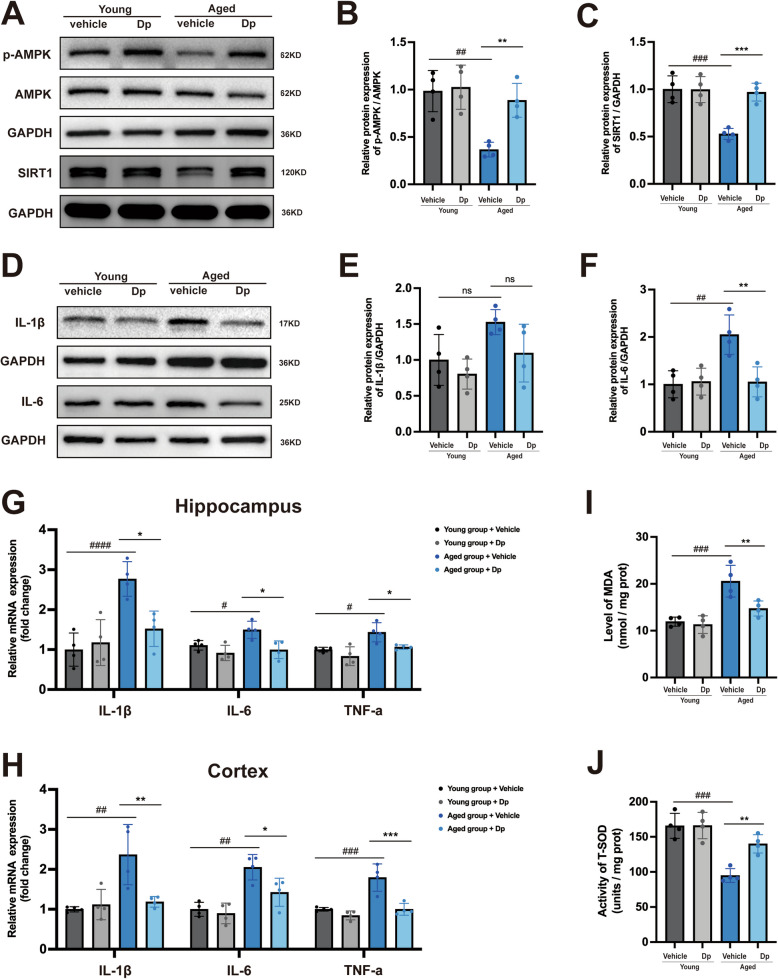
Methods: We employed APP/PS1 mice, naturally aged mice, and an in vitro model using Aβ42-induced senescent BV2 microglia. Delphinidin's effects were evaluated through assessments of cognitive function, synaptic integrity (synapse loss), Aβ plaque burden, senescent microglia gene signatures, and cellular senescence markers (including senescence-associated β-galactosidase activity, SASP factor expression, oxidative stress, and cyclin p21/p16 levels). Mechanistic studies involved analyzing the AMPK/SIRT1 signaling pathway, testing direct delphinidin-SIRT1 interaction, and using the AMPK inhibitor Compound C.

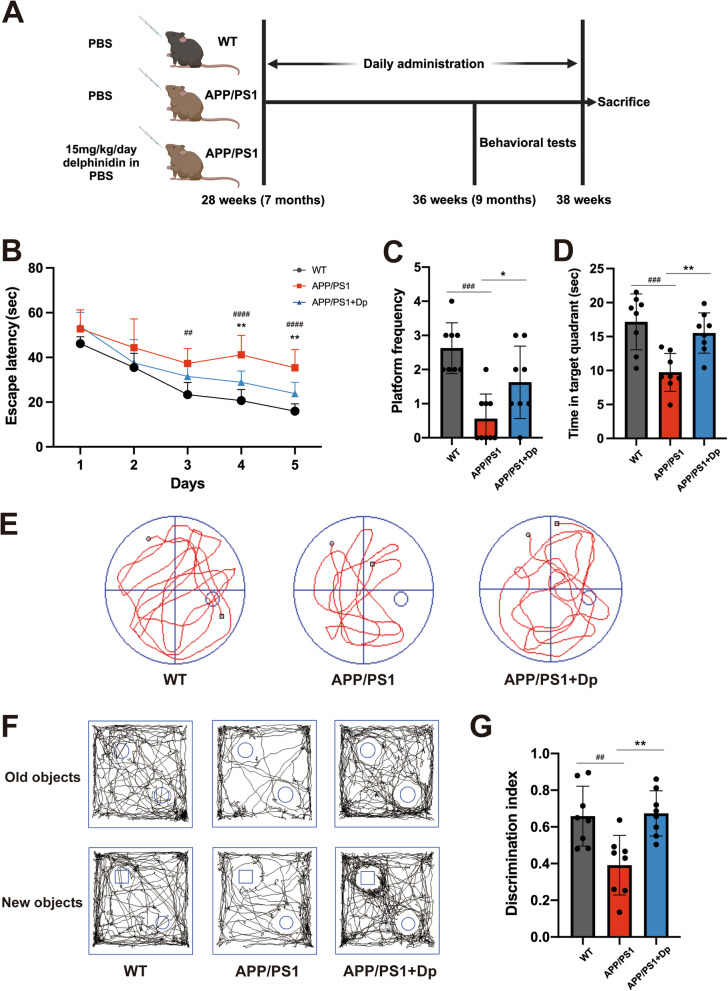
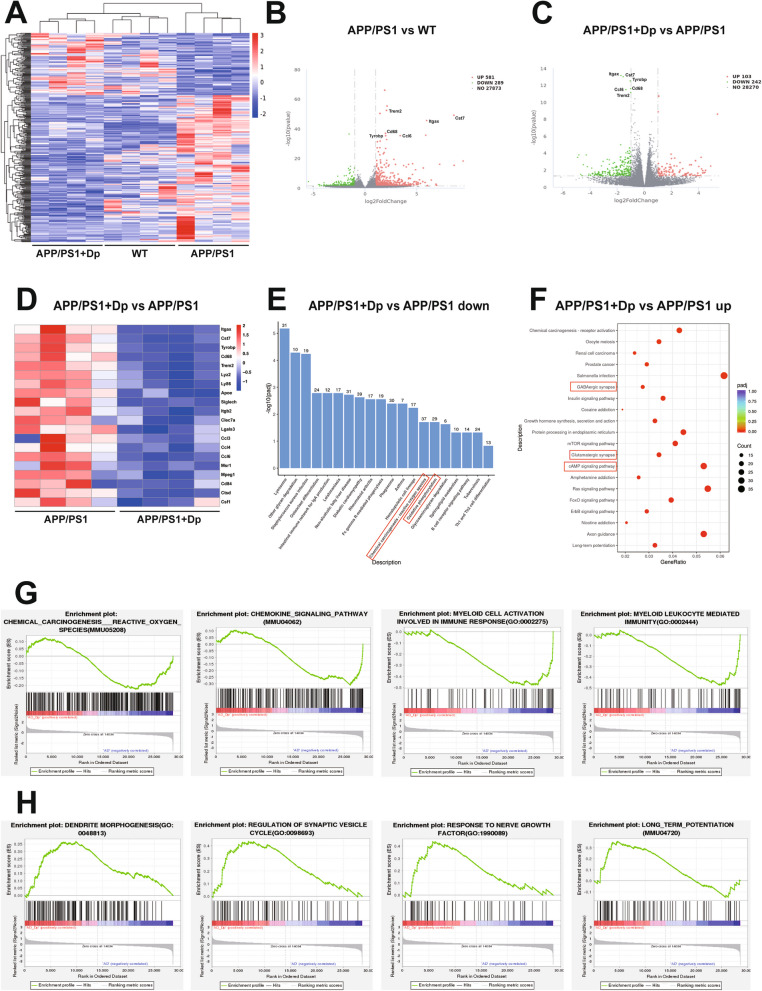
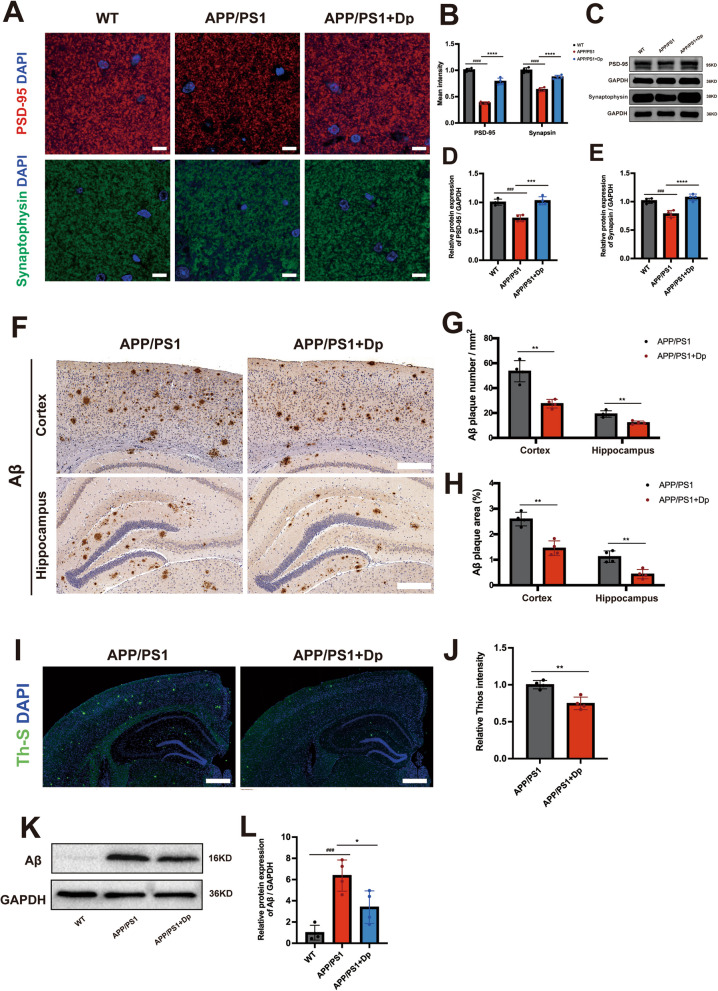
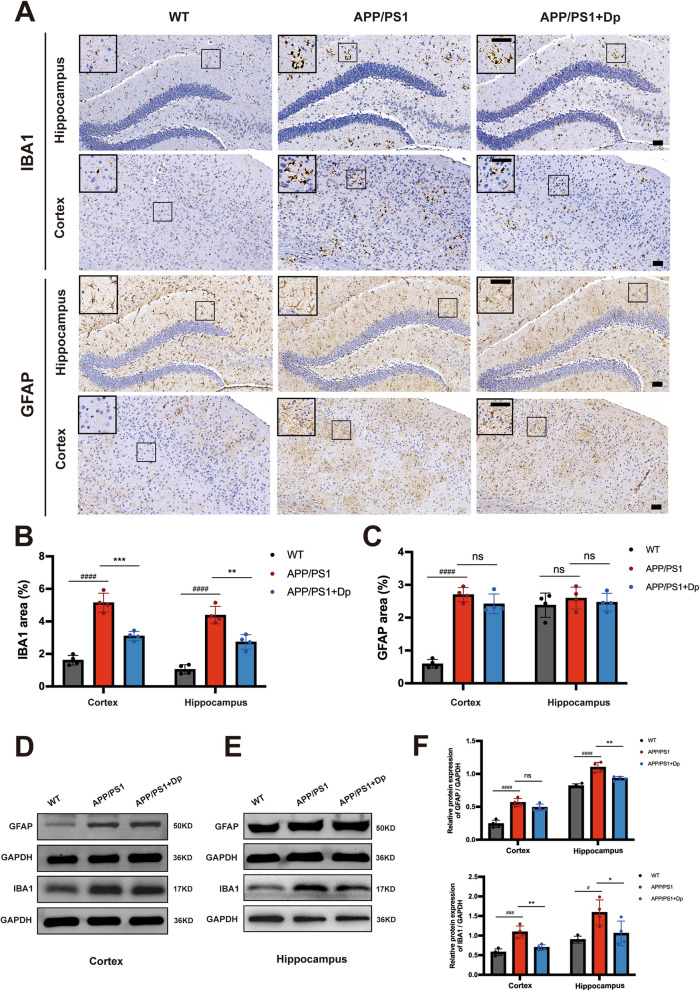
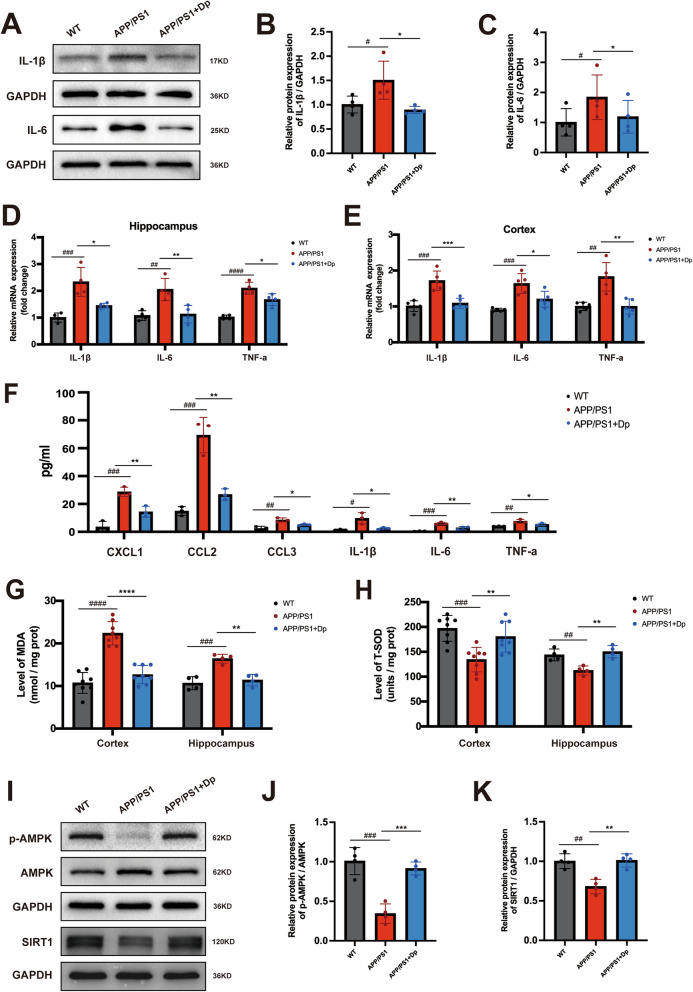
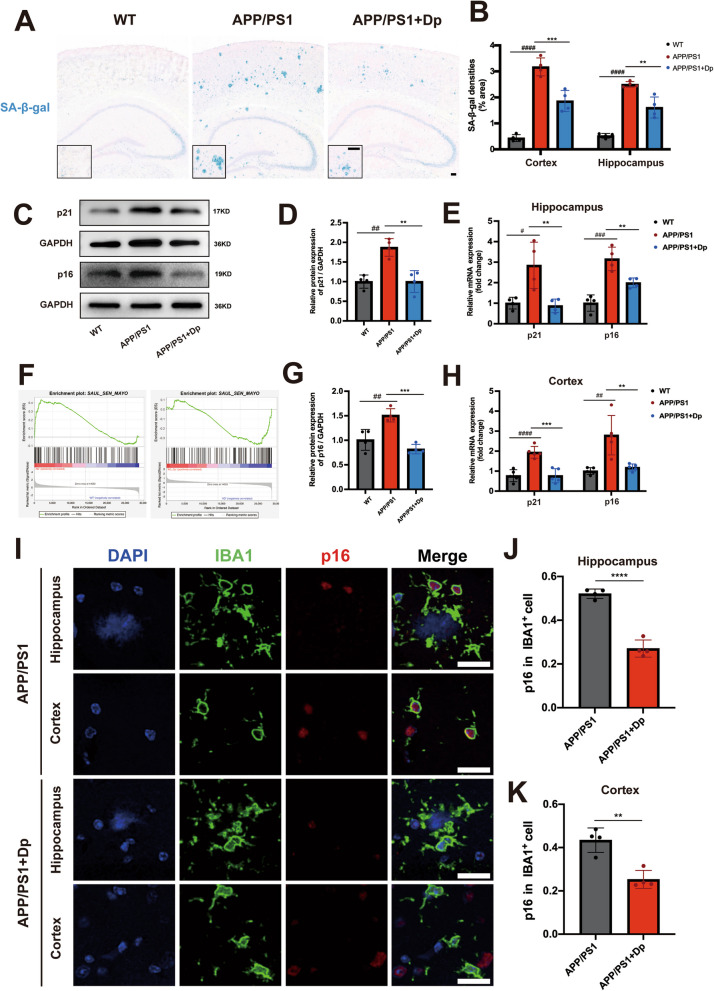
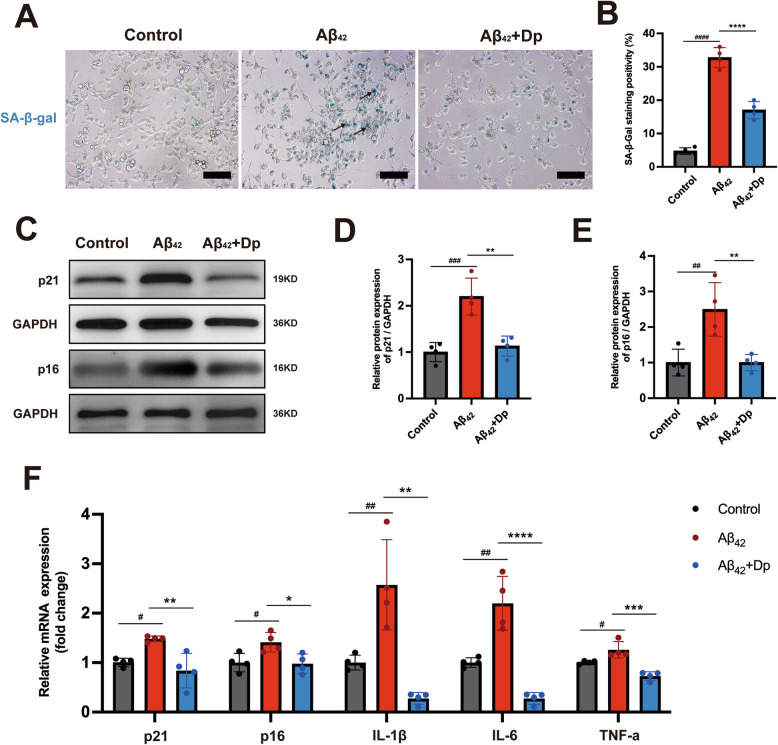
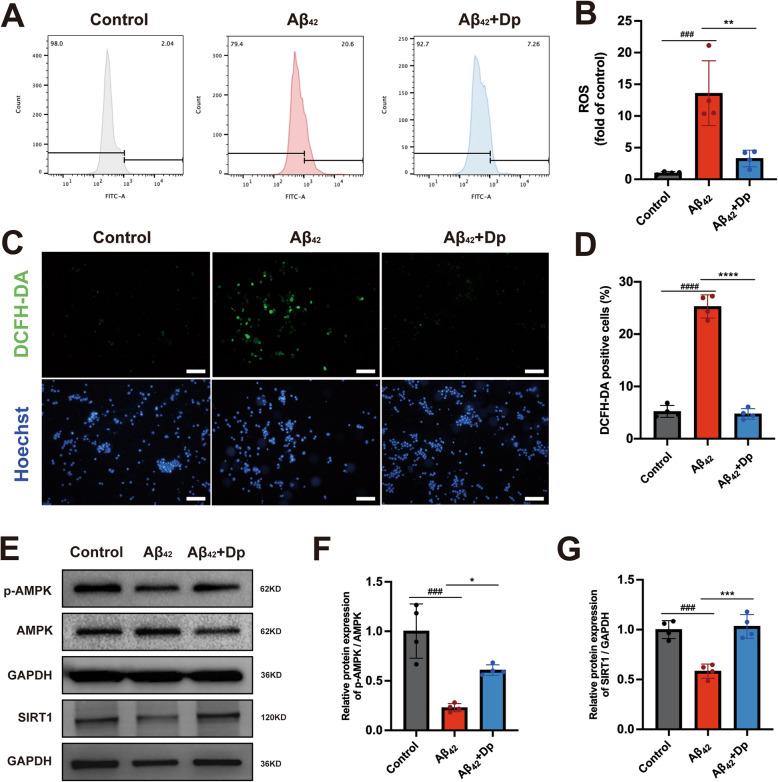
Results: Delphinidin treatment significantly alleviated cognitive deficits, synapse loss, Aβ peptides plaques of APP/PS1 mice via downregulated senescent microglia gene signature, prevented cell senescence, including senescence-associated β-galactosidase activity, senescence-associated secretory phenotype (SASP), oxidative stress, cyclin p21 and p16. And delphinidin treatment also prevented microglial senescence in naturally aged mice. In vitro, delphinidin treatment attenuated cell senescence induced by Aβ42 in BV2 microglia cells. Further research indicated that delphinidin treatment enhanced the AMPK/SIRT1 signaling pathway. Additionally, delphinidin was found to directly interact with SIRT1. It's noteworthy that AMPK inhibitor Compound C inversed the protective effect of delphinidin against microglial senescence.

Conclusion: Our study reveals for the first time that delphinidin effectively improved cognitive deficits, alleviated synapse loss and Aβ pathology in APP/PS1 mice by mitigating microglial senescence. These findings highlight delphinidin as a promising natural anti-aging agent against the development of aging and age-related diseases.

Keywords: AMPK; Aging; Alzheimer's disease; Microglial senescence; Neuroinflammation.


Conflict of interest statement

Declarations. Ethics approval and consent to participate: Approval of the study protocol was obtained from the Experimental Animal Ethics Committee of Fudan University (License No. 2022110017S). All animal experimental were conducted in compliance with the guidelines established by the Animal Research: Reporting of In Vivo Experiments (ARRIVE). Competing interests: The authors declare no competing interests.

Figures

Fig. 1
Fig. 1
Delphinidin ameliorates learning and memory deficits in APP/PS1 mice. A This schematic diagram outlines the experimental design used to investigate the effects of delphinidin treatment on APP/PS1 mice. B-E Evaluating the effects of delphinidin on learning and memory through the Morris Water Maze (MWM) test. B The escape latency during spatial acquisition training. C, D Number of platform crossings and time spent in the target quadrant in the spatial probe test. E Representative motion track during the spatial probe test. After the MWM test was completed, the mice were subjected to the object recognition test. F Representative motion track and (G) the discrimination index of the object recognition test. n = 8 mice. Data were presented as mean ± SD. ## p < 0.005, ### p < 0.0005 versus vehicle-treated WT mice, * p < 0.05, ** p < 0.005 versus vehicle-treated APP/PS1 mice. Dp: delphinidin; WT: wildtype
Fig. 2
Fig. 2
Effects of delphinidin on the gene expression profiles in APP/PS1 mice. A A heatmap illustrating hierarchical clustering of co-regulated differentially expressed genes (DEGs) across three distinct experimental groups. B, C Volcano plotting displaying DEGs between WT versus APP/PS1 mice and APP/PS1 versus delphinidin-treated APP/PS1 mice. D The heatmap showing DEGs associated with cell senescence. E, F The diagram showed the top 20 significantly down-regulated (E) and up-regulated (F) KEGG pathways of DEGs between APP/PS1 and delphinidin-treated APP/PS1 mice. G, H KEGG and GO term of gene set enrichment analysis between APP/PS1 and delphinidin-treated APP/PS1 mice. n = 4 mice. Dp: delphinidin; WT: wildtype
Fig. 3
Fig. 3
Delphinidin prevents synaptic loss and reduces Aβ plaques in APP/PS1 mice. A Representative PSD-95 and Synaptophysin immunostaining in the CA1. Scale bar = 50 μm. B Quantitative intensity analysis of PSD-95 and Synaptophysin immunostaining in the hippocampus. C Western blot analysis of PSD-95 and Synaptophysin in the hippocampus of mice. D, E Quantification of PSD-95/GAPDH (D) and Synaptophysin/GAPDH (E) in C. F Representative immunohistochemistry (IHC) staining of Aβ plaques in the brain. Scale bar = 200 μm. G, H Quantitative analysis of Aβ IHC staining number (G) and area (H) in the cortex and hippocampus. I Representative Th-S positive Aβ plaques in the brain. Scale bar = 500 μm. J Quantitative intensity analysis of Th-S positive staining in the brain. K Western blot analysis of Aβ and GAPDH in the hippocampus of mice. L Quantification of Aβ/GAPDH in I. n = 4 mice. Data were presented as mean ± SD. ###p < 0.0005, #### p < 0.0001 versus WT mice treated with vehicle, * p < 0.05, ** p < 0.005 versus APP/PS1 mice treated with vehicle. Dp: delphinidin; WT: wildtype
Fig. 4
Fig. 4
Delphinidin suppresses microglia activation in APP/PS1 mice. A Representative IHC staining of IBA1 and GFAP in the brains of APP/PS1 mice treated with delphinidin or vehicle and their WT littermates treated with vehicle. Scale bar = 50 μm. B Quantitative analysis of IBA1 immunostaining area in A. C Quantitative analysis of GFAP immunostaining area in A. D Western blot analysis of GFAP, IBA1 and GAPDH in the cortex of mice. E Western blot analysis of GFAP, IBA1 and GAPDH in the hippocampus of mice. F Quantification of GFAP/GAPDH and IBA1/GAPDH in D and E. n = 4 mice. Data were presented as mean ± SD. # p < 0.05, #### p < 0.0001 versus vehicle-treated WT mice, * p < 0.05, ** p < 0.005, *** p < 0.0005 versus vehicle-treated APP/PS1 mice, ns, not significant. Dp: delphinidin; WT: wildtype
Fig. 5
Fig. 5
Delphinidin reduces pro-inflammatory cytokine production and oxidative stress while upregulating the AMPK/SIRT1 pathway in APP/PS1 mice. A Western blot analysis of IL-1β, IL-6 and GAPDH in the hippocampus of mice. (n = 4 mice). B, C Quantification of IL-1β/GAPDH (B) and IL-6/GAPDH (C) in A. D The mRNA expression of IL-1β, IL-6 and TNF-α in the hippocampus were detected by qRT-PCR. (n = 4 mice). E The mRNA expression of IL-1β, IL-6, and TNF-α in the cortex were detected by qRT-PCR. (n = 5 mice). F Proinflammatory cytokines or chemokines CXCL1, CCL2, CCL3, IL-1β, IL6 and TNF-α levels were detected by cytokine array in the serum of APP/PS1 mice treated with delphinidin or vehicle and their WT littermates treated with vehicle. (n = 3 mice). G The level of MDA in the cortex and hippocampus of mice. (n = 8 mice for cortex, n = 4 mice for hippocampus). H The level of T-SOD activity in the cortex and hippocampus of mice. (n = 8 mice for cortex, n = 4 mice for hippocampus). I Western blot analysis of p-AMPK, AMPK, SIRT1 and GAPDH in the hippocampus of mice. (n = 4 mice). J, K Quantification of p-AMPK/AMPK (J) and SIRT1/GAPDH (K) in I. Data were presented as mean ± SD. # p < 0.05, ## p < 0.005, ### p < 0.0005, #### p < 0.0001 versus vehicle-treated WT mice, * p < 0.05, ** p < 0.005, *** p < 0.0005, **** p < 0.0001 versus vehicle-treated APP/PS1 mice. Dp: delphinidin; WT: wildtype
Fig. 6
Fig. 6
Delphinidin prevents microglial senescence in APP/PS1 mice. A Representative SA-β-gal staining in the brains of APP/PS1 mice treated with delphinidin or vehicle and their WT littermates treated with vehicle. Scale bar = 100 μm. B Quantification of SA-β-gal staining densities in A. (n = 4 mice). C Western blot analysis of p16INK4a, p21cip1 and GAPDH in the hippocampus of mice. (n = 4 mice). D Quantification of p21cip1/GAPDH in C. (n = 4 mice). E The mRNA expression of p16INK4a and p21cip1 in the hippocampus were detected by qRT-PCR. (n = 4 mice). F Gene set enrichment analysis of SenMayo gene set between WT versus APP/PS1 mice and APP/PS1 versus delphinidin-treated APP/PS1 mice. G Quantification of p16INK4a/GAPDH in C. (n = 4 mice). H The mRNA expression of p16INK4a and p21cip1 in the cortex were detected by qRT-PCR. (n = 5 mice). I Immunofluorescence of IBA1 (green) with p16INK4a (red) in the hippocampus and cortex of APP/PS1 mice treated with delphinidin or vehicle. Scale bar = 20 μm. J, K Quantification the proportion of p16INK4a-positive cells among IBA+ cells in the hippocampus (J) and cortex (K) of APP/PS1 mice treated with delphinidin or vehicle. (n = 4 mice). Data were presented as mean ± SD. # p < 0.05, ## p < 0.005, ### p < 0.0005, #### p < 0.0001 versus vehicle-treated WT mice, ** p < 0.005, *** p < 0.0005, **** p < 0.0001 versus vehicle-treated APP/PS1 mice, ns, not significant. Dp: delphinidin; WT: wildtype
Fig. 7
Fig. 7
Delphinidin ameliorates microglial senescence induced by the Aβ42 oligomers in BV2 microglia cells. A Representative SA-β-gal staining in BV2 microglia cells. Black arrows point to representative SA-β-gal staining positive cells. Scale bar = 20 μm. B Quantification of SA-β-gal staining positive cells in A. C Western blot analysis of p21cip1, p16INK4a and GAPDH in BV2 microglia cells. D, E Quantification of p21cip1/GAPDH (D) and p16INK4a/GAPDH (E) in C. F The mRNA expression of p16INK4a, p21cip1, IL-1β, IL-6, and TNF-α in BV2 microglia cells were detected by qRT-PCR. n = 4. Data are presented as mean ± SD. # p < 0.05, ## p < 0.005, ### p < 0.0005, #### p < 0.0001 versus vehicle-treated cells, * p < 0.05, ** p < 0.005, *** p < 0.0005, **** p < 0.0001 versus Aβ42 oligomers-treated cells. Dp: delphinidin
Fig. 8
Fig. 8
Delphinidin decreases excessive ROS production while enhancing the AMPK/SIRT1 pathway induced by the Aβ42 oligomers in BV2 microglia cells. A, B Assessment of ROS production in BV2 microglia cells via flow cytometry following loading with the ROS indicator DCFH-DA. C Representative image of BV2 microglia cells loaded with DCFH-DA (green) and Hoechst (blue). Scale bar = 50 μm. D Quantification the proportion of DCFH-DA positive cells in C. E Western blot analysis of p-AMPK, AMPK, SIRT1 and GAPDH in BV2 microglia cells. F, G Quantification of p-AMPK/AMPK (F) and SIRT1/GAPDH (G) in E. n = 4. Data are presented as mean ± SD. ### p < 0.0005, #### p < 0.0001 versus vehicle-treated cells, * p < 0.05, ** p < 0.005, *** p < 0.0005, **** p < 0.0001 versus Aβ42 oligomers-treated cells. ROS, reactive oxygen species; Dp: delphinidin
Fig. 9
Fig. 9
Delphinidin inhibits microglial senescence induced by Aβ42 through the AMPK/SIRT1 pathway. A Western blot analysis of p-AMPK, AMPK, SIRT1 and GAPDH in BV2 microglia cells. B, C Quantification of p-AMPK/AMPK (B) and SIRT1/GAPDH (C) in A. D Representative SA-β-gal staining in BV2 microglia cells. Scale bar = 20 μm. E Quantification of SA-β-gal staining positive cells in D. F, G Assessment of ROS production in BV2 microglia cells via flow cytometry following loading with the ROS indicator DCFH-DA. H Western blot analysis of p21cip1, p16INK4a and GAPDH in BV2 microglia cells. (I-J) Quantification of p21cip1/GAPDH (I) and p16INK4a/GAPDH (J) in C. K The mRNA expression of p16INK4a, p21cip1, IL-1β, IL-6, and TNF-α in BV2 microglia cells were detected by qRT-PCR. n = 4. Data are presented as mean ± SD. # p < 0.05, ## p < 0.005, ### p < 0.0005, #### p < 0.0001 versus Aβ42 oligomers and delphinidin treated cells, * p < 0.05, ** p < 0.005, **** p < 0.0001 versus Aβ42 oligomers-treated cells. ROS, reactive oxygen species; Dp: delphinidin
Fig. 10
Fig. 10
Direct interaction between SIRT1 and delphinidin. A The docking mode of delphinidin with SIRT1 protein. B Root Mean Square Deviation (RMSD) analysis showing the binding of delphinidin with SIRT1 protein. C Gyration radius (Rg) analysis showing the binding of delphinidin with SIRT1 protein. D The number of hydrogen bonds formed between delphinidin and SIRT1 protein. E Root Mean Square Fluctuation (RMSF) analysis showing the binding of delphinidin with SIRT1 protein
Fig. 11
Fig. 11
Delphinidin also reduces microglial senescence in aged mice. A Representative IHC staining of GFAP and IBA1 in the brains of young mice treated with delphinidin or vehicle and aged mice treated with delphinidin or vehicle. Scale bar = 50 μm. B Quantitative analysis of GFAP immunostaining area in A. C Quantitative analysis of IBA1 immunostaining area in A. D, E The mRNA expression of p16INK4a and p21cip1 in the hippocampus (D) and cortex (E) were detected by qRT-PCR. F Western blot analysis of p16INK4a, p21cip1 and GAPDH in the hippocampus of mice. (n = 4 mice). G, H Quantification of p21cip1/GAPDH (G) and p16INK4a/GAPDH (H) in F. I Immunofluorescence of IBA1 (green) with p16INK4a(red) in the hippocampus and cortex of aged mice treated with delphinidin or vehicle. Scale bar = 20 μm. J Quantification the proportion of p16INK4a-positive cells among IBA+ cells in the hippocampus and cortex of aged mice treated with delphinidin or vehicle. n = 4 mice. Data are presented as mean ± SD. # p < 0.05, ### p < 0.0005, #### p < 0.0001 versus vehicle-treated young mice, * p < 0.05, ** p < 0.005, *** p < 0.0005 versus vehicle-treated aged mice, ns, not significant. Dp: delphinidin
Fig. 12
Fig. 12
Delphinidin suppresses pro-inflammatory cytokine production, oxidative stress while upregulates the AMPK/SIRT1 pathway in aged mice. A Western blot analysis of p-AMPK, AMPK, SIRT1 and GAPDH in the hippocampus of mice. B, C Quantification of p-AMPK/AMPK (B) and SIRT1/GAPDH (C) in A. D Western blot analysis of IL-1β, IL-6 and GAPDH in the hippocampus of mice. E, F Quantification of IL-1β/GAPDH (E) and IL-6/GAPDH (F) in D. G, H The mRNA expression of IL-1β, IL-6, and TNF-α in the hippocampus (G) and cortex (H) were detected by qRT-PCR. I The level of MDA in the hippocampus of mice. J The level of T-SOD activity in the hippocampus of mice. n = 4 mice. Data are presented as mean ± SD. # p < 0.05, ## p < 0.005, ### p < 0.0005, #### p < 0.0001 versus vehicle-treated young mice, * p < 0.05, ** p < 0.005, *** p < 0.0005 versus vehicle-treated aged mice, ns, not significant. Dp: delphinidin

Similar articles

References

    1. van der Kant R, Goldstein LSB, Ossenkoppele R. Amyloid-beta-independent regulators of tau pathology in Alzheimer disease. Nat Rev Neurosci. 2020;21(1):21–35. - PubMed
    1. Baker DJ, Petersen RC. Cellular senescence in brain aging and neurodegenerative diseases: evidence and perspectives. J Clin Invest. 2018;128(4):1208–16. - PMC - PubMed
    1. Garwood CJ, Simpson JE, Al Mashhadi S, Axe C, Wilson S, Heath PR, et al. DNA damage response and senescence in endothelial cells of human cerebral cortex and relation to Alzheimer’s neuropathology progression: a population-based study in the Medical Research Council Cognitive Function and Ageing Study (MRC-CFAS) cohort. Neuropathol Appl Neurobiol. 2014;40(7):802–14. - PubMed
    1. Hu Y, Fryatt GL, Ghorbani M, Obst J, Menassa DA, Martin-Estebane M, et al. Replicative senescence dictates the emergence of disease-associated microglia and contributes to Aβ pathology. Cell Rep. 2021;35(10): 109228. - PMC - PubMed
    1. Li R, Li Y, Zuo H, Pei G, Huang S, Hou Y. Alzheimer's Amyloid-beta Accelerates Cell Senescence and Suppresses SIRT1 in Human Neural Stem Cells. Biomolecules. 2024;14(2):189. - PMC - PubMed

MeSH terms

LinkOut - more resources